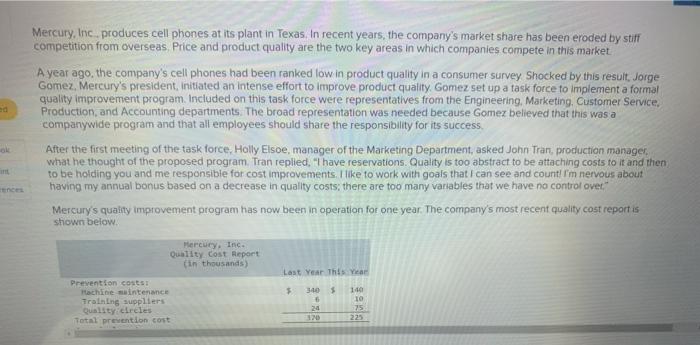
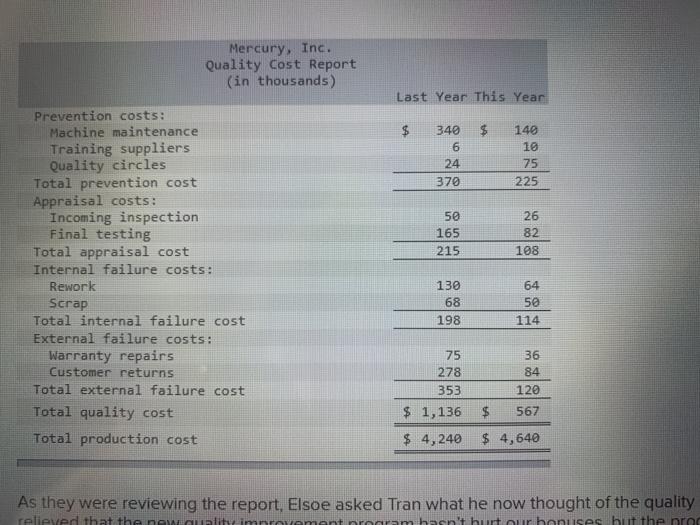
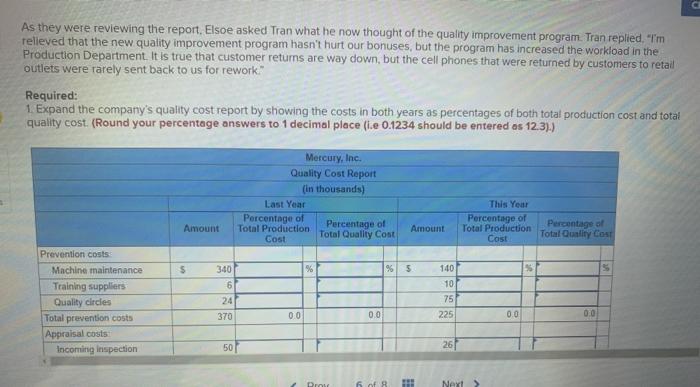
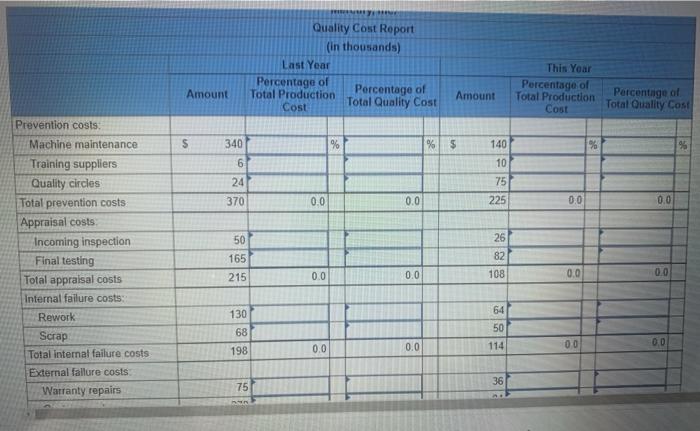
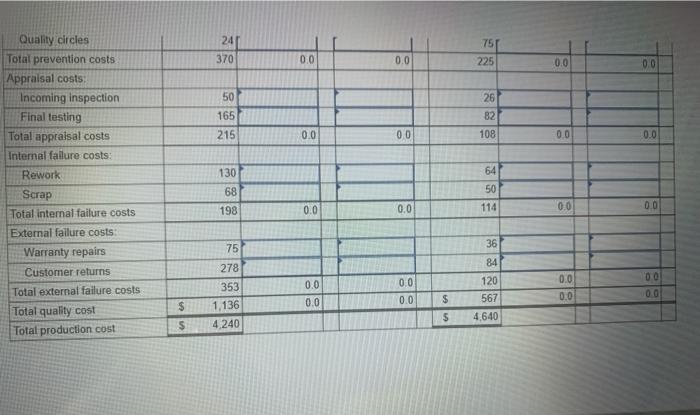
Mercury, Inc. produces cell phones at its plant in Texas. In recent years, the company's market share has been eroded by stiff competition from overseas, Price and product quality are the two key areas in which companies compete in this market A year ago, the company's cell phones had been ranked low in product quality in a consumer survey Shocked by this result. Jorge Gomez, Mercury's president, initiated an intense effort to improve product quality. Gomez set up a task force to implement a formal quality improvement program. Included on this task force were representatives from the Engineering, Marketing, Customer Service. Production, and Accounting departments. The broad representation was needed because Gomez believed that this was a companywide program and that all employees should share the responsibility for its success After the first meeting of the task force, Holly Elsoe, manager of the Marketing Department, asked John Tran, production manager. what he thought of the proposed program Tran replied, "I have reservations. Quality is too abstract to be attaching costs to it and then to be holding you and me responsible for cost improvements. I like to work with goals that I can see and count! I'm nervous about having my annual bonus based on a decrease in quality costs; there are too many variables that we have no control ovet Mercury's quality improvement program has now been in operation for one year. The company's most recent quality cost report is shown below Mercury, Inc. Quality Cost Report (in thousands Last Year This Year 140 Prevention costs: Machine maintenance Training suppliers Quality circles Total prevention cost 6 24 120 10 75 225 Mercury, Inc. Quality Cost Report (in thousands) Last Year This Year LA $ $ 340 6 24 370 140 10 75 225 50 165 215 26 82 108 Prevention costs: Machine maintenance Training suppliers Quality circles Total prevention cost Appraisal costs: Incoming inspection Final testing Total appraisal cost Internal failure costs: Rework Scrap Total internal failure cost External failure costs: Warranty repairs Customer returns Total external failure cost Total quality cost Total production cost 64 130 68 198 50 114 75 278 353 36 84 120 $ 1,136 $ 567 $ 4,240 $ 4,640 As they were reviewing the report, Elsoe asked Tran what he now thought of the quality relieved that the new titivement Gram hasn't hurt our bonuses but the prog As they were reviewing the report, Elsoe asked Tran what he now thought of the quality improvement program. Tran replied, "I'm relieved that the new quality improvement program hasn't hurt our bonuses, but the program has increased the workload in the Production Department. It is true that customer returns are way down, but the cell phones that were returned by customers to retail outlets were rarely sent back to us for rework." Required: 1. Expand the company's quality cost report by showing the costs in both years as percentages of both total production cost and total quality cost. (Round your percentage answers to 1 decimal place (ie 0.1234 should be entered as 12.3).) Mercury, Inc. Quality Cost Report (in thousands) Last Year Percentage of Total Production Percentage of Cost Total Quality Cont This Year Percentage of Total Production Cost Amount Amount Percentage of Total Quality Cost $ % % 5 140 5 340 6 10 Prevention costs Machine maintenance Training suppliers Quality circles Total prevention costs Appraisal costs Incoming Inspection 24 370 75 225 0.0 0.0 0.0 0.0 50 26 6 of 8 FH Next > Quality Cost Report (in thousands) Last Year Percentage of Total Production Percentage of Cost Total Quality Cost Amount This Year Percentage of Total Production Cost Amount Percentage of Total Quality Cost S 340 % % 5 96 140 10 6 24 75 370 0.0 0.0 225 00 0.0 50 26 Prevention costs Machine maintenance Training suppliers Quality circles Total prevention costs Appraisal costs Incoming inspection Final testing Total appraisal costs Internal failure costs: Rework Scrap Total internal failure costs External fallure costs Warranty repairs 165 215 82 108 0.0 0.0 0.0 0.0 64 130 68 50 114 0.0 00 00 0.0 198 36 75 75 24 370 00 0.0 225 0.0 0.0 50 26 B2 165 215 0.0 00 108 00 0.0 130 64 Quality circles Total prevention costs Appraisal costs Incoming inspection Final testing Total appraisal costs Internal failure costs: Rework Scrap Total internal failure costs External failure costs: Warranty repairs Customer returns Total external failure costs Total quality cost Total production cost 68 50 114 198 0.0 0.0 00 0.0 36 75 278 0.0 84 120 567 0.0 0.0 0.0 00 00 0.0 $ 0.0 353 1.136 4 240 $ $ 4,640 S