

Answered step by step
Verified Expert Solution
Question
1 Approved Answer
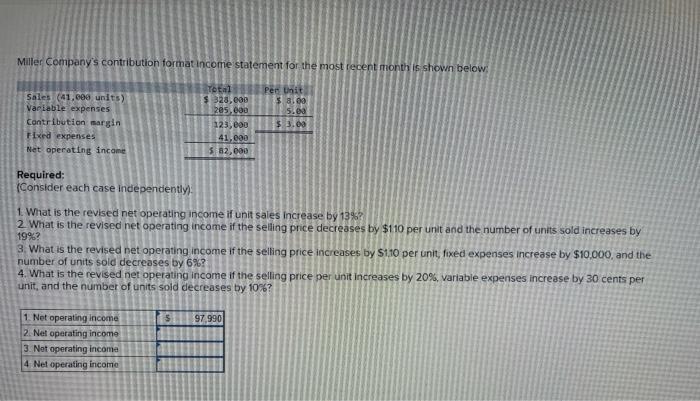
Miller Company's contribution format income statement for the most recent month is shown below Sales (41.000 units) Var Lable expenses Contribution margin Fixed expenses Net
Step by Step Solution
There are 3 Steps involved in it
Step: 1

Get Instant Access to Expert-Tailored Solutions
See step-by-step solutions with expert insights and AI powered tools for academic success
Step: 2

Step: 3
Ace Your Homework with AI
Get the answers you need in no time with our AI-driven, step-by-step assistance
Get Started
Innovation Audit Workbook
Authors: Langdon Morris
1st Edition
B08HBBKKPJ, 979-8682091614