

Question
Miller Tree Service You are an owner of a logging company looking to bid on the plots you plan to cut this year. You need
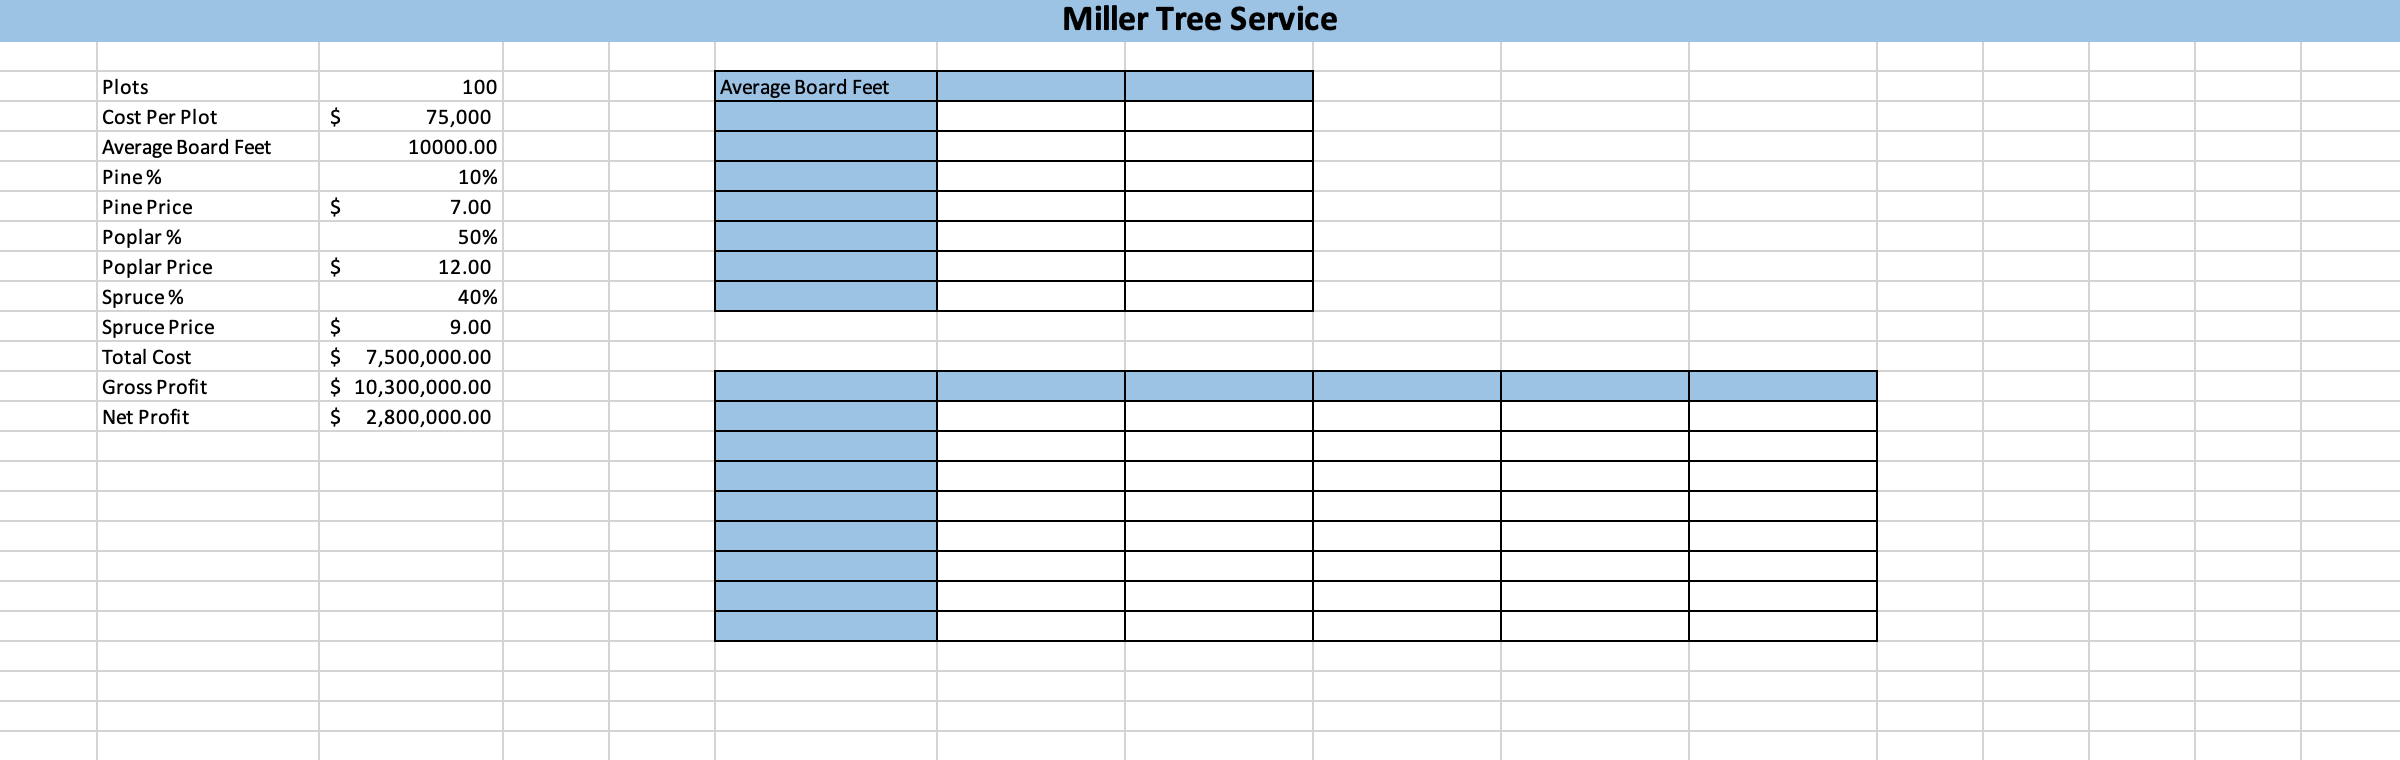
Miller Tree Service
You are an owner of a logging company looking to bid on the plots you plan to cut this year. You need to perform some analysis of the risk, reward, and break-even points based on how many plots you purchase, the average production per plot, and the cost you pay per plot. Historically, the distribution of the type of trees on these plots are consistent and the price for each type of tree have been estimated for the season.
Range Names
You need to configure the range of input data to simplify the creation of the formulas used by Excels Analysis tools.
- Open ExcelExam2Ch6StartFile and save as ExcelExam2Ch6_LastFirst.
- Open the Analysis worksheet and create new named ranges for the existing inputs in B2:C14.
- Assign the name Number_of_Plots to cell C3.
- Edit the formula in C14 to use the named ranges instead of the cell references.
Goal Seek
You had to purchase new machinery to harvest the wood for this season. You need to determine how many board feet you need to average to cover the cost of the new machinery.
- Use Goal Seek to determine what the Average Board Feet must be if you bid on 100 plots at $75,000 each to cover your $2 million net profit.
- Answer Question 1 on the Results worksheet.
One-Variable Data Table
You need to perform some analysis on Gross and Net Profit based on different averages of board feet per plot.
- Starting in F4, complete a series of substitutions starting at 7500 in increments of 500 and a max of 10500, going down vertically.
- Enter the references for Gross Profit and Net Profit, respectively, in the columns.
- Complete the one-variable data table.
- Format the results to Accounting Number Format with Zero decimal places.
- Change G3 and H3 to display Gross Profit and Net Profit, respectively.
- Answer Question 2 on the Results worksheet.
Two-Variable Data Table
You need to look at how the number of plots and cost per plot can affect your net profit.
- Starting in G14, complete a series of substitutions starting at 50 in increments of 25 for a max of 150, going across horizontally.
- Starting in F15, complete a series of substitutions starting at 45000 in increments of 15000 for a max of 135000, going down vertically.
- Complete the two-variable data table by adding the reference for Net Profit.
- Format the results to Accounting Number Format with Zero decimal places.
- Change F14 to display Cost per Plot.
- Merge and center cells G13:K13 and add a heading Number of Plots.
- Answer Question 3 on the Results worksheet.
Scenario Manager
Prices for each wood can change, so you need to perform a what-if analysis if the prices move up or down from the current estimates.
- Create a scenario named Best Case using the following pricing:
- Pine = $9.00
- Poplar = $14.00
- Spruce = $11.00
- Create a scenario named Most Likely using the following pricing:
- Pine = $7.00
- Poplar = $12.00
- Spruce = $9.00
- Create a scenario named Worst Case using the following pricing:
- Pine = $5.00
- Poplar = $10.00
- Spruce = $7.00
- Generate the Scenario Summary using Total Cost, Gross Profit, and Net Profit.
- Format the headings to display each name instead of the range names.
- Answer Question 4 on the Results worksheet.
Step by Step Solution
There are 3 Steps involved in it
Step: 1

Get Instant Access with AI-Powered Solutions
See step-by-step solutions with expert insights and AI powered tools for academic success
Step: 2

Step: 3
Ace Your Homework with AI
Get the answers you need in no time with our AI-driven, step-by-step assistance
Get Started