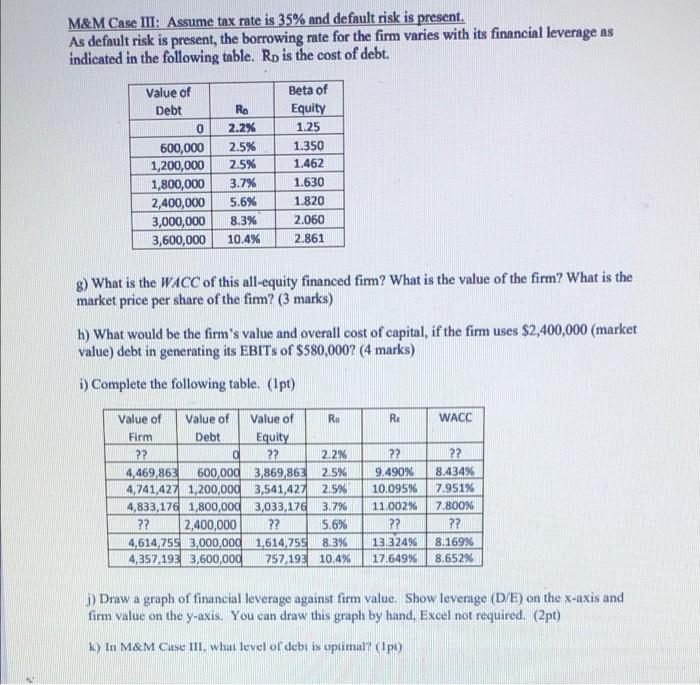
M&M Case III: Assume tax rate is 35% and default risk is present. As default risk is present, the borrowing rate for the firm varies with its financial leverage as indicated in the following table. Rp is the cost of debt. Value of Debt 0 600,000 1,200,000 1,800,000 2,400,000 3,000,000 3,600,000 Ra 2.2% 2.5% 2.5% 3.7% 5.6% 8.3% 10.4% Beta of Equity 1.25 1.350 1.462 1.630 1.820 2.060 2.861 g) What is the WACC of this all-equity financed firm? What is the value of the firm? What is the market price per share of the firm? (3 marks) h) What would be the firm's value and overall cost of capital, if the firm uses $2,400,000 (market value) debt in generating its EBITs of $580,000? (4 marks) i) Complete the following table. (1pt) R: WACC Value of Value of Value of Ro Firm Debt Equity ?? O ?? 2.2% 4,469,863 600,000 3,869,863 2.5% 4,741,427 1,200,000 3,541,427 2.5% 4,833,17 1,800,000 3,033,176 3.7% ?? 2,400,000 ?? 5.6% 4,614 759 3,000,000 1,614,758.3% 4,357 1933,600,000 757 19 10.4% ?? 9.490% 10.095% 11.002% 22 13 324% 17.649% ?? 8.434% 7.951% 7.800% 22 8.169% 8.652% j) Draw a graph of financial leverage against firm value. Show leverage (D/E) on the x-axis and firm value on the y-axis. You can draw this graph by hand. Excel not required. (2pt) k) In M&M Case III. what level of debt is optimal? dpi) M&M Case III: Assume tax rate is 35% and default risk is present. As default risk is present, the borrowing rate for the firm varies with its financial leverage as indicated in the following table. Rp is the cost of debt. Value of Debt 0 600,000 1,200,000 1,800,000 2,400,000 3,000,000 3,600,000 Ra 2.2% 2.5% 2.5% 3.7% 5.6% 8.3% 10.4% Beta of Equity 1.25 1.350 1.462 1.630 1.820 2.060 2.861 g) What is the WACC of this all-equity financed firm? What is the value of the firm? What is the market price per share of the firm? (3 marks) h) What would be the firm's value and overall cost of capital, if the firm uses $2,400,000 (market value) debt in generating its EBITs of $580,000? (4 marks) i) Complete the following table. (1pt) R: WACC Value of Value of Value of Ro Firm Debt Equity ?? O ?? 2.2% 4,469,863 600,000 3,869,863 2.5% 4,741,427 1,200,000 3,541,427 2.5% 4,833,17 1,800,000 3,033,176 3.7% ?? 2,400,000 ?? 5.6% 4,614 759 3,000,000 1,614,758.3% 4,357 1933,600,000 757 19 10.4% ?? 9.490% 10.095% 11.002% 22 13 324% 17.649% ?? 8.434% 7.951% 7.800% 22 8.169% 8.652% j) Draw a graph of financial leverage against firm value. Show leverage (D/E) on the x-axis and firm value on the y-axis. You can draw this graph by hand. Excel not required. (2pt) k) In M&M Case III. what level of debt is optimal? dpi)


