Answered step by step
Verified Expert Solution
Question
1 Approved Answer
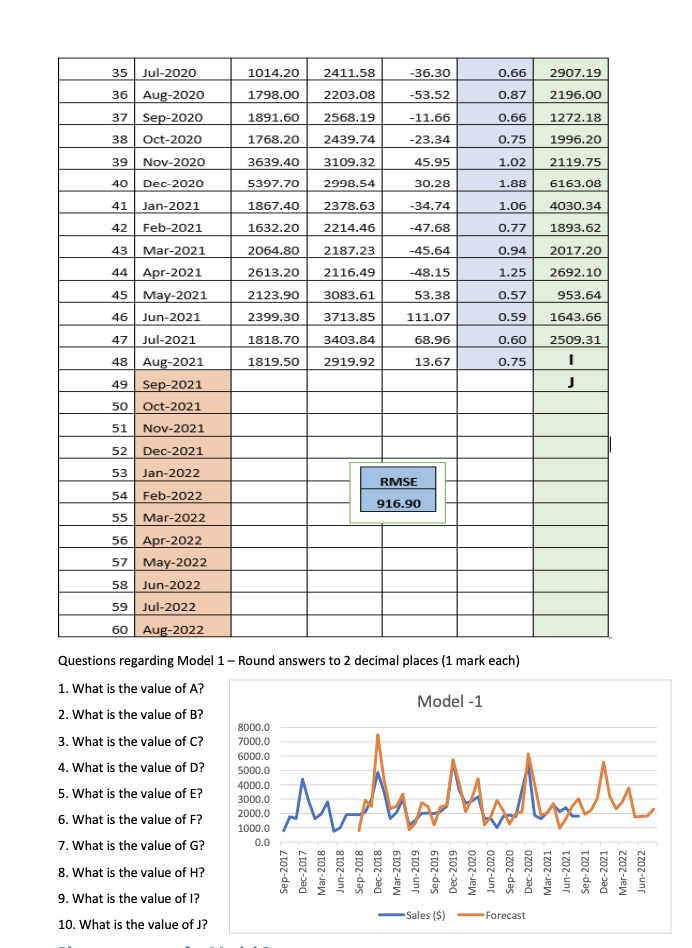
Model 1 (Winters) - Top section of the spreadsheet Trend 0.4 Sales ($) Level 791.60 Seasonal Forecast 0.40 Time Date 1 Sep-2017 2 Oct-2017 3
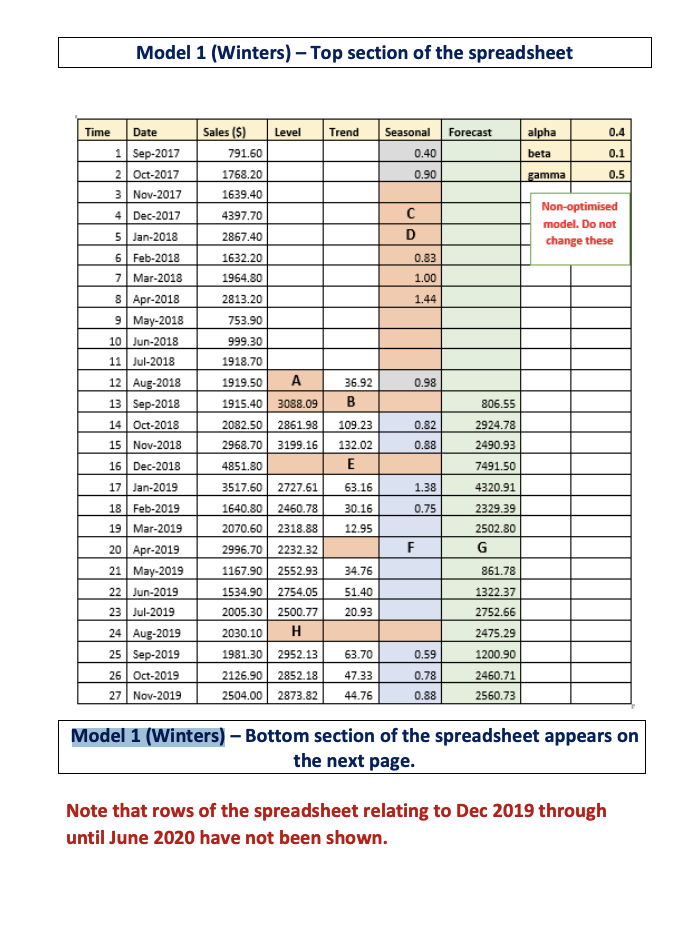
Model 1 (Winters) - Top section of the spreadsheet Trend 0.4 Sales ($) Level 791.60 Seasonal Forecast 0.40 Time Date 1 Sep-2017 2 Oct-2017 3 Nov-2017 alpha beta gamma 0.1 0.5 0.90 1768.20 1639.40 4 Dec-2017 4397.70 D Non-optimised model. Do not change these 5 Jan-2018 2867.40 0.83 1632.20 1964.80 1.00 2813.20 1.44 753.90 6 Feb-2018 7 Mar-2018 8 Apr-2018 9 May-2018 10 Jun-2018 11 Jul-2018 12 Aug-2018 13 Sep-2018 14 Oct-2018 0.98 36.92 B 806.55 0.82 999.30 1918.70 1919.50 A 1915.40 3088.09 2082.50 2861.98 2968.70 3199.16 4851.80 3517.50 2727.61 1640.80 2460.78 2070.60 2318.88 109.23 132.02 E 0.88 2924.78 2490.93 7491.50 63.16 4320.91 1.38 0.75 30.16 12.95 2329.39 2502.80 G 2996.70 2232.32 F 15 Nov-2018 16 Dec-2018 17Jan-2019 18 Feb-2019 19 Mar-2019 20 Apr-2019 21 May-2019 22 Jun-2019 23 Jul-2019 24 Aug-2019 25 Sep-2019 26 Oct-2019 27 Nov-2019 1167.90 2552.93 34.76 861.78 1322.37 51.40 20.93 2752.66 2475.29 1534.90 2754.05 2005.30 2500.77 2030.10 H 1981.30 2952.13 2126.90 2852.18 2504.00 2873.82 63.70 0.59 1200.90 47.33 0.78 2460.71 2560.73 44.76 0.88 Model 1 (Winters) - Bottom section of the spreadsheet appears on the next page. Note that rows of the spreadsheet relating to Dec 2019 through until June 2020 have not been shown. 1014.20 2411.58 -36.30 0.66 2907.19 2203.08 -53.52 0.87 35 Jul-2020 36 Aug-2020 37 Sep-2020 38 Oct-2020 1798.00 1891.60 1768.20 2196.00 1272.18 2568.19 -11.66 0.66 2439.74 -23.34 0.75 1996.20 39 Nov-2020 3639.40 45.95 1.02 2119.75 3109.32 2998.54 40 Dec-2020 5397.70 30.28 1.88 6163.08 41 Jan-2021 1867.40 2378.63 -34.74 1.06 4030.34 42 Feb-2021 2214.46 -47.68 0.77 1632.20 2064.80 1893.62 2017.20 2187.23 -45.64 0.94 2613.20 2116.49 -48.15 1.25 2692.10 2123.90 3083.61 53.38 0.57 953.64 2399.30 3713.85 111.07 0.59 43 Mar-2021 44 Apr-2021 45 May-2021 46 Jun-2021 47 Jul-2021 48 Aug-2021 49 Sep-2021 50 Oct-2021 1818.70 3403.84 68.96 0.60 1643.66 2509.31 I J 1819.50 2919.92 13.67 0.75 51 Nov-2021 52 Dec-2021 53 Jan-2022 RMSE 54 Feb-2022 916.90 55 Mar-2022 56 Apr-2022 57 May-2022 58 Jun-2022 59 Jul-2022 60 Aug-2022 8000.0 7000.0 Questions regarding Model 1 - Round answers to 2 decimal places (1 mark each) 1. What is the value of A? Model -1 2. What is the value of B? 3. What is the value of c? 6000.0 4. What is the value of D? 5000.0 4000.0 5. What is the value of E? 6. What is the value of F? 1000.0 7. What is the value of G? 8. What is the value of H? 9. What is the value of 1? Sales ($) 10. What is the value of J? Anhalah 3000.0 2000.0 0.0 Sep-2017 Dec-2017 Mar-2018 Jun-2018 Sep-2018 Dec-2018 Mar-2019 Jun-2019 Sep-2019 Dec-2019 Mar-2020 Jun-2020 Sep-2020 Dec-2020 Mar-2021 Jun-2021 Sep-2021 Dec-2021 Mar-2022 Jun-2022 Forecast Model 1 (Winters) - Top section of the spreadsheet Trend 0.4 Sales ($) Level 791.60 Seasonal Forecast 0.40 Time Date 1 Sep-2017 2 Oct-2017 3 Nov-2017 alpha beta gamma 0.1 0.5 0.90 1768.20 1639.40 4 Dec-2017 4397.70 D Non-optimised model. Do not change these 5 Jan-2018 2867.40 0.83 1632.20 1964.80 1.00 2813.20 1.44 753.90 6 Feb-2018 7 Mar-2018 8 Apr-2018 9 May-2018 10 Jun-2018 11 Jul-2018 12 Aug-2018 13 Sep-2018 14 Oct-2018 0.98 36.92 B 806.55 0.82 999.30 1918.70 1919.50 A 1915.40 3088.09 2082.50 2861.98 2968.70 3199.16 4851.80 3517.50 2727.61 1640.80 2460.78 2070.60 2318.88 109.23 132.02 E 0.88 2924.78 2490.93 7491.50 63.16 4320.91 1.38 0.75 30.16 12.95 2329.39 2502.80 G 2996.70 2232.32 F 15 Nov-2018 16 Dec-2018 17Jan-2019 18 Feb-2019 19 Mar-2019 20 Apr-2019 21 May-2019 22 Jun-2019 23 Jul-2019 24 Aug-2019 25 Sep-2019 26 Oct-2019 27 Nov-2019 1167.90 2552.93 34.76 861.78 1322.37 51.40 20.93 2752.66 2475.29 1534.90 2754.05 2005.30 2500.77 2030.10 H 1981.30 2952.13 2126.90 2852.18 2504.00 2873.82 63.70 0.59 1200.90 47.33 0.78 2460.71 2560.73 44.76 0.88 Model 1 (Winters) - Bottom section of the spreadsheet appears on the next page. Note that rows of the spreadsheet relating to Dec 2019 through until June 2020 have not been shown. 1014.20 2411.58 -36.30 0.66 2907.19 2203.08 -53.52 0.87 35 Jul-2020 36 Aug-2020 37 Sep-2020 38 Oct-2020 1798.00 1891.60 1768.20 2196.00 1272.18 2568.19 -11.66 0.66 2439.74 -23.34 0.75 1996.20 39 Nov-2020 3639.40 45.95 1.02 2119.75 3109.32 2998.54 40 Dec-2020 5397.70 30.28 1.88 6163.08 41 Jan-2021 1867.40 2378.63 -34.74 1.06 4030.34 42 Feb-2021 2214.46 -47.68 0.77 1632.20 2064.80 1893.62 2017.20 2187.23 -45.64 0.94 2613.20 2116.49 -48.15 1.25 2692.10 2123.90 3083.61 53.38 0.57 953.64 2399.30 3713.85 111.07 0.59 43 Mar-2021 44 Apr-2021 45 May-2021 46 Jun-2021 47 Jul-2021 48 Aug-2021 49 Sep-2021 50 Oct-2021 1818.70 3403.84 68.96 0.60 1643.66 2509.31 I J 1819.50 2919.92 13.67 0.75 51 Nov-2021 52 Dec-2021 53 Jan-2022 RMSE 54 Feb-2022 916.90 55 Mar-2022 56 Apr-2022 57 May-2022 58 Jun-2022 59 Jul-2022 60 Aug-2022 8000.0 7000.0 Questions regarding Model 1 - Round answers to 2 decimal places (1 mark each) 1. What is the value of A? Model -1 2. What is the value of B? 3. What is the value of c? 6000.0 4. What is the value of D? 5000.0 4000.0 5. What is the value of E? 6. What is the value of F? 1000.0 7. What is the value of G? 8. What is the value of H? 9. What is the value of 1? Sales ($) 10. What is the value of J? Anhalah 3000.0 2000.0 0.0 Sep-2017 Dec-2017 Mar-2018 Jun-2018 Sep-2018 Dec-2018 Mar-2019 Jun-2019 Sep-2019 Dec-2019 Mar-2020 Jun-2020 Sep-2020 Dec-2020 Mar-2021 Jun-2021 Sep-2021 Dec-2021 Mar-2022 Jun-2022 Forecast
Step by Step Solution
There are 3 Steps involved in it
Step: 1
Get Instant Access to Expert-Tailored Solutions
See step-by-step solutions with expert insights and AI powered tools for academic success
Step: 2
Step: 3
Ace Your Homework with AI
Get the answers you need in no time with our AI-driven, step-by-step assistance
Get Started