Answered step by step
Verified Expert Solution
Link Copied!

Question

1 Approved Answer

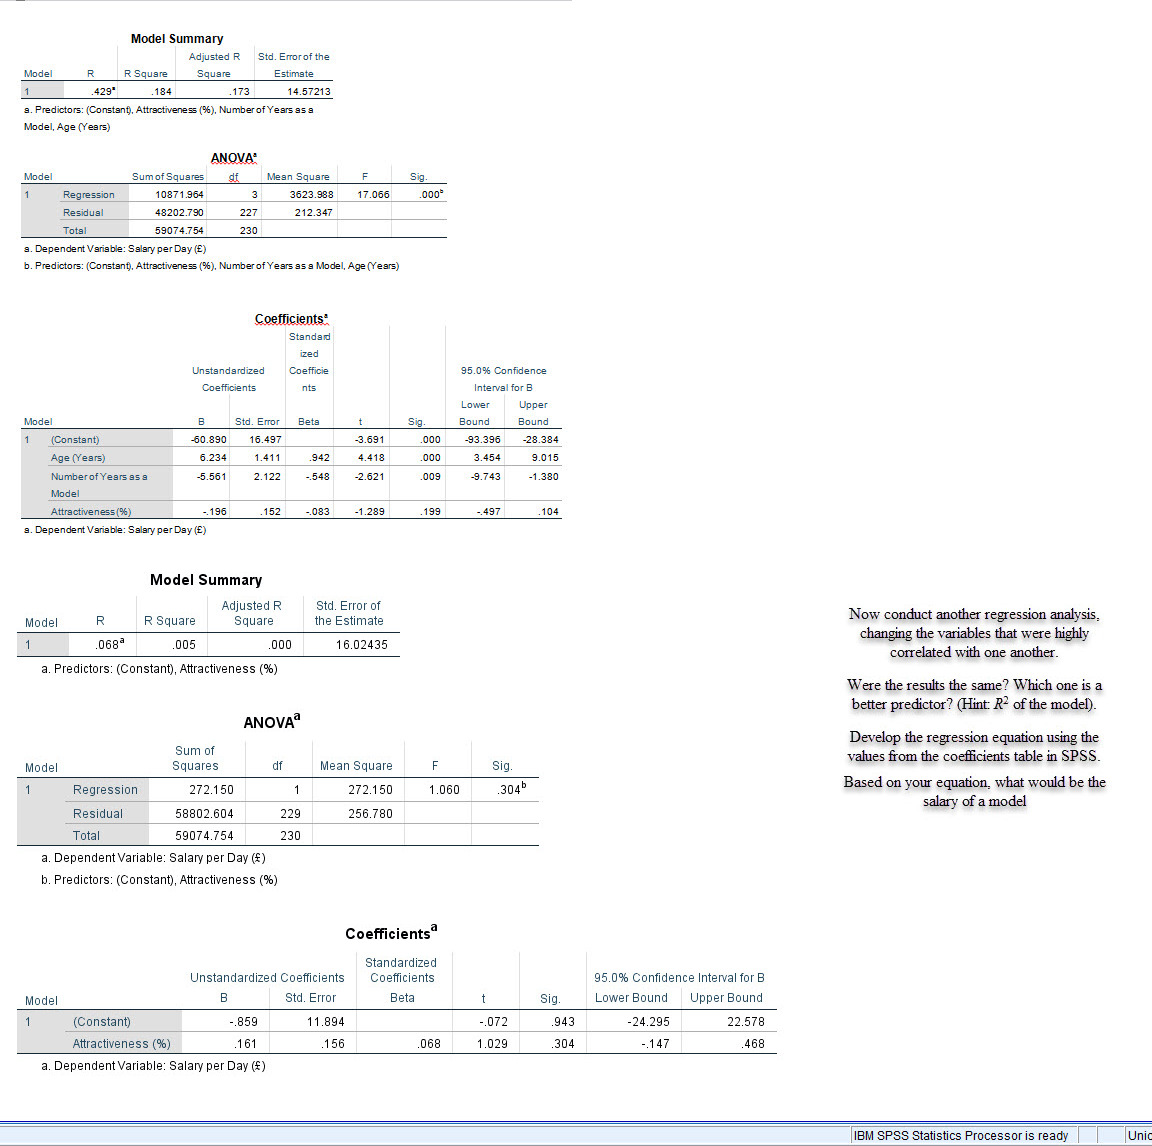
Model Summary Adjusted R Std. Errorof the Model R Square Square Estimate .429 .18 .173 14.57213 a. Predictors: (Constant), Attractiveness (96). Number of Years as

image text in transcribed
Model Summary Adjusted R Std. Errorof the Model R Square Square Estimate .429" .18 .173 14.57213 a. Predictors: (Constant), Attractiveness (96). Number of Years as a Model, Age (Years) ANOVA Model Sum of Squares df Mean Square Sig. Regression 10871.96 3 3623.988 17.056 .000 Residual 8202.790 127 212.34 Total 59074.754 230 . Dependent Variable: Salary per Day (E) . Predictors: (Constant), Attractiveness (%), Number of Years as a Model, Age (Years) Coefficients Standard Instandardized Coefficie 95.0% Confidence Coefficients nts terval for B Lower Upper Model B Std. Error Beta sig. Bound Bound (Constant) 60.890 16.497 -3.69 .000 -93.396 28.384 Age (Years) 6.234 1.411 942 4.418 .000 3.454 9.015 Number of Years as a 5.561 2.122 548 -2.621 .005 9.743 1.380 Model Attractiveness (96) -.196 157 -.083 -1.289 199 -.497 .104 a. Dependent Variable: Salary per Day (E) Model Summary Adjusted R Std. Error of Model R R Square Square the Estimate Now conduct another regression analysis. changing the variables that were highly .0683 .005 .000 16.02435 correlated with one another. . Predictors: (Constant), Attractiveness (%) Were the results the same? Which one is a better predictor? (Hint: R- of the model). ANOVA Develop the regression equation using the Sum of values from the coefficients table in SPSS Model Squares df Mean Square Sig Regression 272.150 272.150 1.060 .304 Based on your equation, what would be the salary of a model Residual +0970889 229 256.780 Total 59074.754 230 . Dependent Variable: Salary per Day (f) . Predictors: (Constant), Attractiveness (96) Coefficients Standardized Unstandardized Coefficients Coefficients 95.0% Confidence Interval for B Model B Std. Error Beta sig Lower Bound Upper Bound (Constant) .859 11.894 -.072 943 24.295 22.578 Attractiveness (%) 161 156 068 1.029 304 .147 468 a. Dependent Variable: Salary per Day (f) IBM SPSS Statistics Processor is ready

Step by Step Solution

There are 3 Steps involved in it

Step: 1

blur-text-image

Get Instant Access to Expert-Tailored Solutions

See step-by-step solutions with expert insights and AI powered tools for academic success

Step: 2

blur-text-image

Step: 3

blur-text-image

Ace Your Homework with AI

Get the answers you need in no time with our AI-driven, step-by-step assistance

Get Started

Recommended Textbook for

Birds Higher Engineering Mathematics

Authors: John Bird

9th Edition

1000353036, 9781000353037

More Books

Students also viewed these Mathematics questions

Question

Describe an incentive plan based on commission.

Answered: 1 week ago