

Question
Module 5 Crosstabulation Worksheet Name: _____________________ In this assignment, you will use the SPSS Analysis Data Set and SPSS software to compute crosstabulations and create
Module 5 Crosstabulation Worksheet
Name: _____________________
In this assignment, you will use the SPSS Analysis Data Set and SPSS software to compute crosstabulations and create pie charts.
Research Scenario
A researcher is interested in the effect of a new medication on blood glucose and white blood cell levels of adults. The researcher randomly selects a sample of 60 (30 male and 30 female) participants with higher-than-normal WBC count.
Assuring equal distribution of males and females, the participants are randomly assigned to one of two conditions (or groups): medication or placebo. Following pretest measures of blood glucose (BLOODGL) and white blood cell (WBC) levels, the experimental group (GROUP 1) is given the medication for a period of six months while the control group (GROUP 2) is given a placebo. After the six months, BLOODGL and WBC are measured again. The researchers also ask if participants have ever been diagnosed with two forms of cancer that cause high WBC count: leukemia and lymphoma (CANCER).
The post-test data for each participant are provided in the SPSS Analysis Data Set located in the Learning Resources. The codebook for the data is as follows:
Codebook
| Variable Name | Label |
| AGE | Age in years |
| SEX | 1 = male, 2 = female |
| GROUP | 1 = medication, 2 = placebo |
| BLOODGL | Blood glucose level (70-250 mg/dL) |
| WBC | White blood cell count (11,000-100,000 per microliter) |
| CHNG_WBC | Change in white blood cells from pre-test to post-test |
| CANCER | 0 = never diagnosed, 1 = cancer diagnosis (leukemia or lymphoma) |
Begin by downloading the SPSS Analysis Data Set (.sav file) to your computer and complete the following steps:
Step 1: Open Data Set
- Open the SPSS software.
- Locate the SPSS Analysis Data Set in your files.
- Click on "Open" and then click on "OK".
Step 2: Run Crosstabulations on Combinations of Categorical Variables
- In the top menu bar, select Analyze > Descriptive Statistics > Crosstabs.
- Highlight GROUP. Click on the arrow button to move it over to the "Row(s)" box
- Highlight SEX and CANCER. Click on the arrow button to move them over to the "Column(s)" box.
- Click on the "Cells" button.
- Under "Counts," select "Observed".
- Under "Percentages," select "Row".
- Click on "Continue".
- Click on "OK".
Step 3: Review SPSS Output and Answer the Following Questions
| QUESTION | Type answers below |
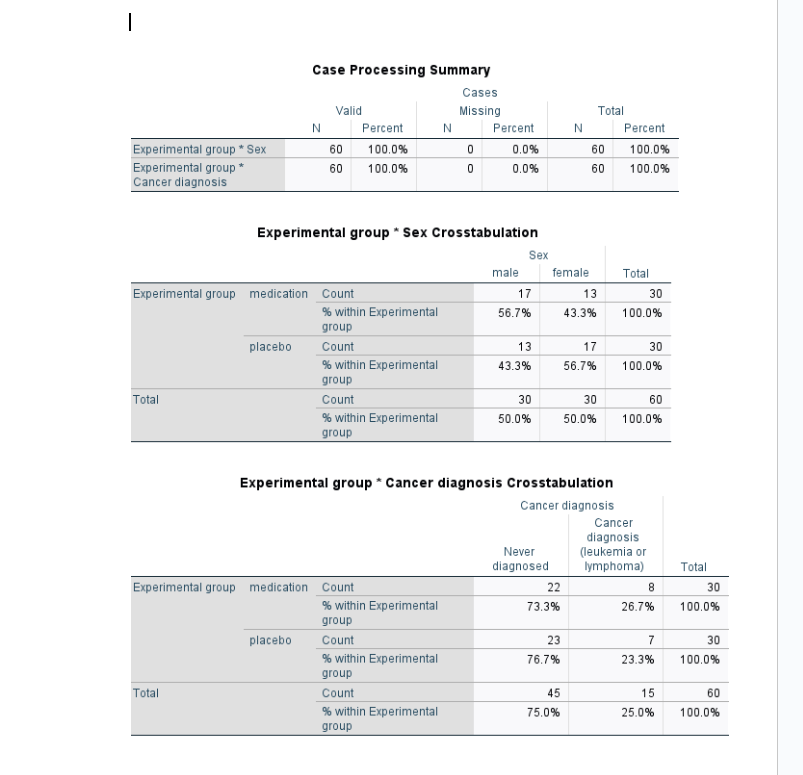
| 1. How many participants in GROUP 1 are male? | |
| 2. What percentage of participants in GROUP 1 are male? | |
| 3. How many participants in GROUP 1 are female? | |
| 4. What percentage of participants in GROUP 1 are female? | |
| 5. How many participants in GROUP 2 are male? | |
| 6. What percentage of participants in GROUP 2 are male? | |
| 7. How many participants in GROUP 2 are female? | |
| 8. What percentage of participants in GROUP 2 are female? | |
| 9. How many participants in GROUP 1 were never diagnosed with cancer? | |
| 10. What percentage of participants in GROUP 1 were never diagnosed with cancer? | |
| 11. How many participants in GROUP 1 have received a cancer diagnosis? | |
| 12. What percentage of participants in GROUP 1 have received a cancer diagnosis? | |
| 13. How many participants in GROUP 2 were never diagnosed with cancer? | |
| 14. What percentage of participants in GROUP 2 were never diagnosed with cancer? | |
| 15. How many participants in GROUP 2 have received a cancer diagnosis? | |
| 16. What percentage of participants in GROUP 2 have received a cancer diagnosis? |
Step 4: Create a Pie Chart for SEX, GROUP, and CANCER
- Click on Graphs > Legacy Dialogs > Pie.
- Leave the default setting on "Summaries for groups of cases." Then click on "Define".
- Under "Slices Represent," select "% of cases".
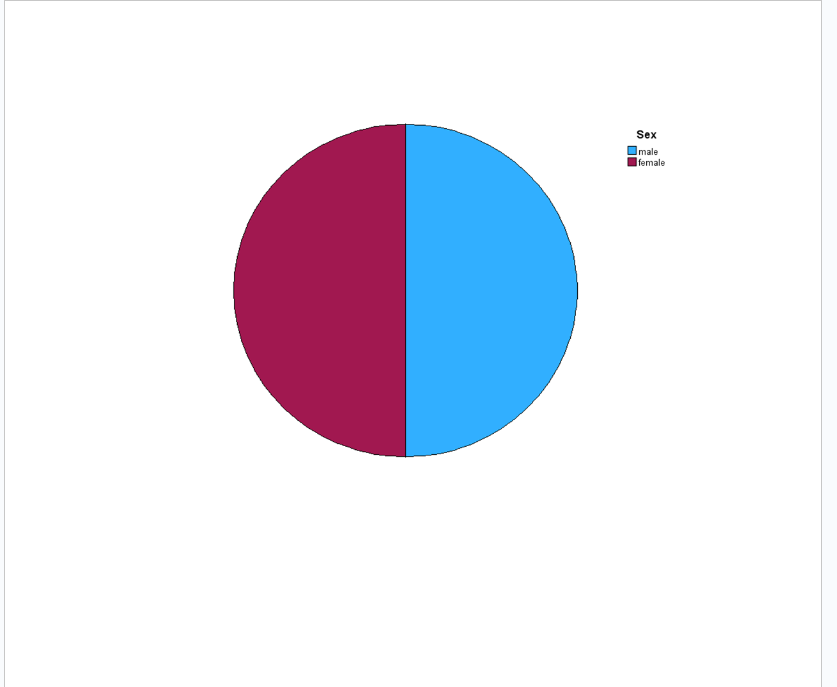
- Highlight SEX. Click on the arrow button to move it over to the "Define slices by" box.
- Click on "OK".
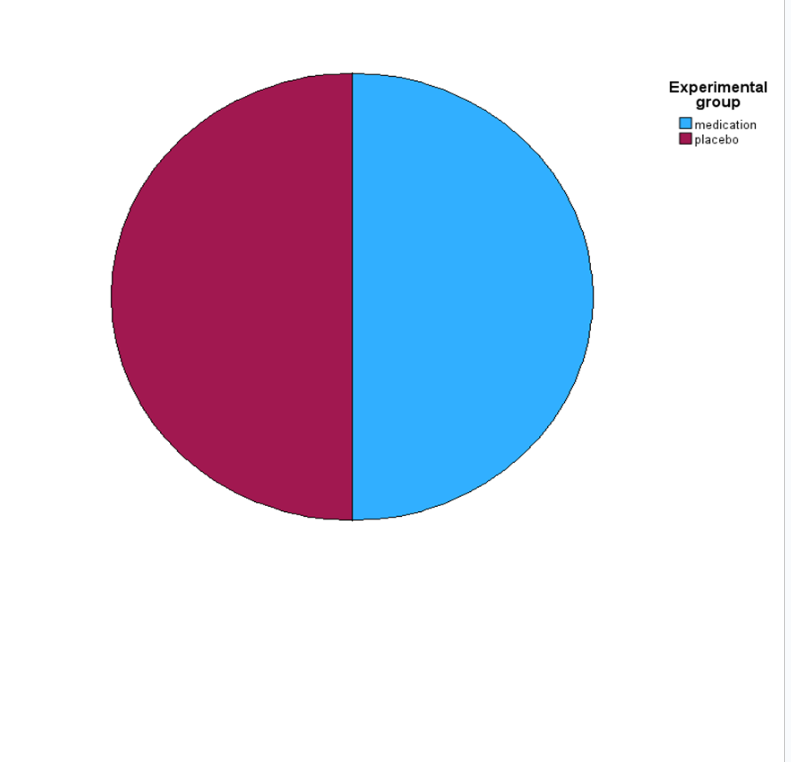
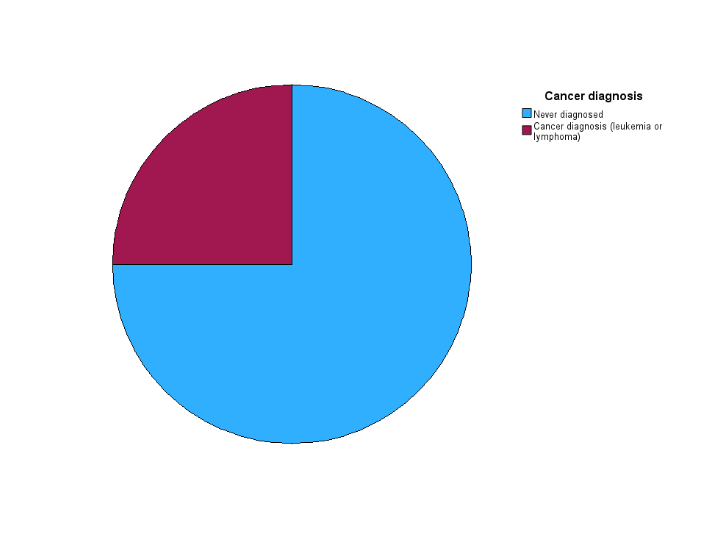
- Repeat these steps for GROUP and CANCER.
Step 4:Export SPSS Output to Word
- In the Output window, select File > Export.
- Under "Objects to Export," select "All".
- From the "Type" drop-down list, select Word/RTF (*.doc)
- In "File Name," give the output a unique name (e.g., OUTPUT_Module5Cross). (Note the file folder where the Word document will be saved. The default is typically C:\Documents.)
- Click on "OK" to generate the Word file.
Step 5: Copy-and-Paste Crosstabulation Tables and Pie Charts to Worksheet
- Copy the following tables/graphs from the Output Word file and paste them below
- Case Processing Summary
- Crosstabulation tables for GROUP*SEX and GROUP*CANCER
- Pie charts for SEX, GROUP, and CANCER
Step by Step Solution
There are 3 Steps involved in it
Step: 1

Get Instant Access to Expert-Tailored Solutions
See step-by-step solutions with expert insights and AI powered tools for academic success
Step: 2

Step: 3
Ace Your Homework with AI
Get the answers you need in no time with our AI-driven, step-by-step assistance
Get Started
Intro Stats
Authors: Richard D. De Veaux, Paul F. Velleman, David E. Bock
3rd edition
321533283, 321533289, 9780321463708, 9780321503848, 9780321503800, 9780321499431, 9780321499417, 978-0321500458