

Question: monia... Molar ... ethods... Part C INSERT GRAPHS (4 TOTAL) - need to have labeled axes and title; graph should take up the whole space
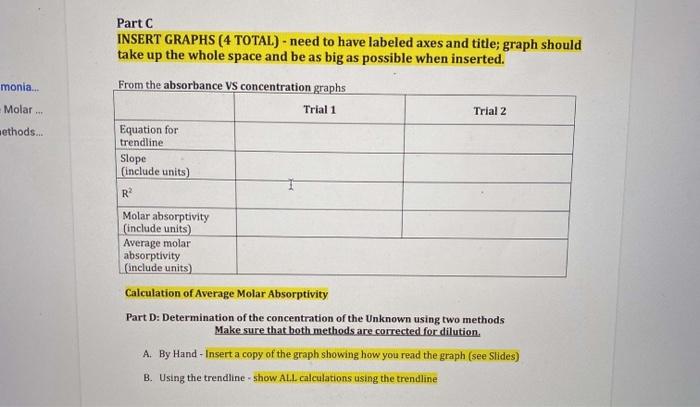
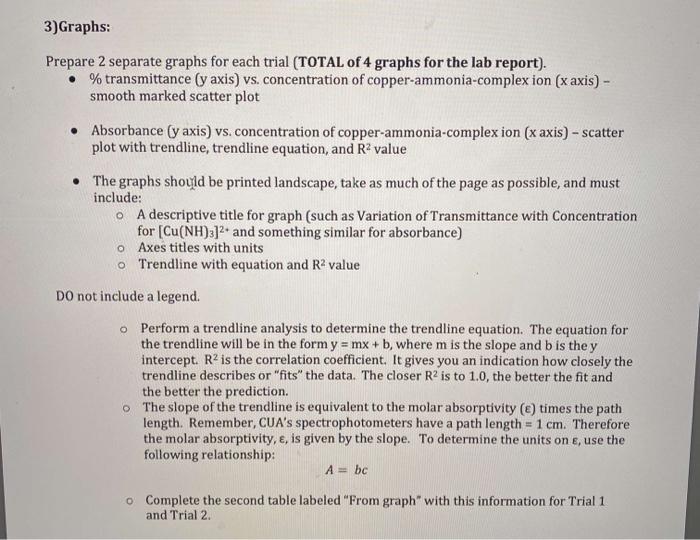
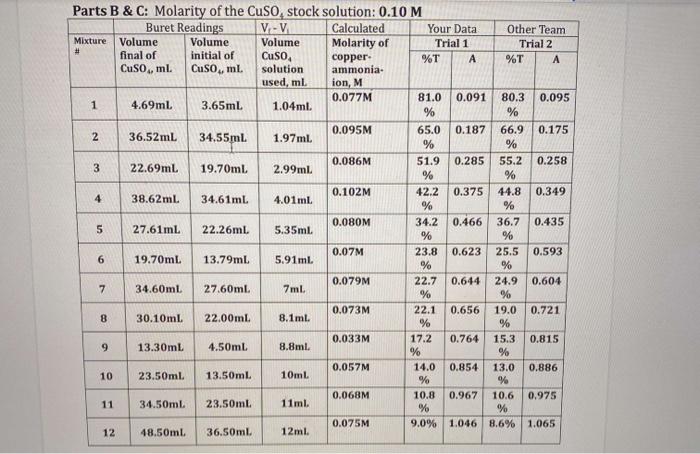
monia... Molar ... ethods... Part C INSERT GRAPHS (4 TOTAL) - need to have labeled axes and title; graph should take up the whole space and be as big as possible when inserted. From the absorbance VS concentration graphs Trial 1 Trial 2 Equation for trendline Slope (include units) R Molar absorptivity (include units) Average molar absorptivity (include units Calculation of Average Molar Absorptivity Part D: Determination of the concentration of the Unknown using two methods Make sure that both methods are corrected for dilution A. By Hand - Insert a copy of the graph showing how you read the graph (see Slides) B. Using the trendline - show All calculations using the trendline 3)Graphs: Prepare 2 separate graphs for each trial (TOTAL of 4 graphs for the lab report). % transmittance (y axis) vs. concentration of copper-ammonia-complex ion (x axis) - smooth marked scatter plot Absorbance (y axis) vs. concentration of copper-ammonia-complex ion (x axis) - scatter plot with trendline, trendline equation, and R2 value The graphs should be printed landscape, take as much of the page as possible, and must include: A descriptive title for graph (such as Variation of Transmittance with Concentration for [Cu(NH):12- and something similar for absorbance) Axes titles with units o Trendline with equation and R2 value o DO not include a legend. o Perform a trendline analysis to determine the trendline equation. The equation for the trendline will be in the form y = mx +b, where m is the slope and b is they intercept. R2 is the correlation coefficient. It gives you an indication how closely the trendline describes or "fits" the data. The closer R2 is to 1.0, the better the fit and the better the prediction. The slope of the trendline is equivalent to the molar absorptivity (c) times the path length. Remember, CUA's spectrophotometers have a path length = 1 cm. Therefore the molar absorptivity, e, is given by the slope. To determine the units on e, use the following relationship: Abc O o Complete the second table labeled "From graph" with this information for Trial 1 and Trial 2. # Parts B&C: Molarity of the Cuso, stock solution: 0.10 M Buret Readings V-V Calculated Your Data Other Team Mixture Volume Volume Volume Molarity of Trial 1 Trial 2 final of initial of Cuso, copper %T A %T A Cuso, ml. Cuso, ml. solution ammonia- used, ml ion, M 0.077M 81.0 0.091 1 80.3 0.095 4.69ml 3.65ml 1.04 ml. % % 0.095M 2 65.0 0.187 66.9 0.175 36.52mL 34.55ml. 1.97ml. % % 0.086M 3 51.9 0.285 55.2 0.258 22.69mL 19.70ml 2.99ml. % % 0.102M 42.2 0.375 44.8 0.349 4 38.62mL. 34.61ml 4.01ml % % 0.080M 5 34.2 0.466 36.7 0.435 27.61ml 22.26ml 5.35ml % % 0.07M 6 23.8 0.623 25.5 0.593 19.70mL 13.79ml 5.91ml % % 0.079M 22.7 0.644 24.9 0.604 7 34.60ml 27.60ml. 7ml % % 0.073M 22.1 0.656 19.0 0.721 8 30.10ml 22.00ml. 8.1ml. % % 0.033M 17.2 0.764 15.3 0.815 9 13.30mL 4.50ml 8.8ml % % 0.057M 14.0 0.854 13.0 0.886 10 23.50ml 13.50ml 10mL % % 0.068M 10.8 0.967 10.6 0.975 11 34.50ml 23.50ml 11ml % % 0.075M 9.0% 1.046 8.6% 1.065 48.50ml 36.50ml. 12ml. 9 12 monia... Molar ... ethods... Part C INSERT GRAPHS (4 TOTAL) - need to have labeled axes and title; graph should take up the whole space and be as big as possible when inserted. From the absorbance VS concentration graphs Trial 1 Trial 2 Equation for trendline Slope (include units) R Molar absorptivity (include units) Average molar absorptivity (include units Calculation of Average Molar Absorptivity Part D: Determination of the concentration of the Unknown using two methods Make sure that both methods are corrected for dilution A. By Hand - Insert a copy of the graph showing how you read the graph (see Slides) B. Using the trendline - show All calculations using the trendline 3)Graphs: Prepare 2 separate graphs for each trial (TOTAL of 4 graphs for the lab report). % transmittance (y axis) vs. concentration of copper-ammonia-complex ion (x axis) - smooth marked scatter plot Absorbance (y axis) vs. concentration of copper-ammonia-complex ion (x axis) - scatter plot with trendline, trendline equation, and R2 value The graphs should be printed landscape, take as much of the page as possible, and must include: A descriptive title for graph (such as Variation of Transmittance with Concentration for [Cu(NH):12- and something similar for absorbance) Axes titles with units o Trendline with equation and R2 value o DO not include a legend. o Perform a trendline analysis to determine the trendline equation. The equation for the trendline will be in the form y = mx +b, where m is the slope and b is they intercept. R2 is the correlation coefficient. It gives you an indication how closely the trendline describes or "fits" the data. The closer R2 is to 1.0, the better the fit and the better the prediction. The slope of the trendline is equivalent to the molar absorptivity (c) times the path length. Remember, CUA's spectrophotometers have a path length = 1 cm. Therefore the molar absorptivity, e, is given by the slope. To determine the units on e, use the following relationship: Abc O o Complete the second table labeled "From graph" with this information for Trial 1 and Trial 2. # Parts B&C: Molarity of the Cuso, stock solution: 0.10 M Buret Readings V-V Calculated Your Data Other Team Mixture Volume Volume Volume Molarity of Trial 1 Trial 2 final of initial of Cuso, copper %T A %T A Cuso, ml. Cuso, ml. solution ammonia- used, ml ion, M 0.077M 81.0 0.091 1 80.3 0.095 4.69ml 3.65ml 1.04 ml. % % 0.095M 2 65.0 0.187 66.9 0.175 36.52mL 34.55ml. 1.97ml. % % 0.086M 3 51.9 0.285 55.2 0.258 22.69mL 19.70ml 2.99ml. % % 0.102M 42.2 0.375 44.8 0.349 4 38.62mL. 34.61ml 4.01ml % % 0.080M 5 34.2 0.466 36.7 0.435 27.61ml 22.26ml 5.35ml % % 0.07M 6 23.8 0.623 25.5 0.593 19.70mL 13.79ml 5.91ml % % 0.079M 22.7 0.644 24.9 0.604 7 34.60ml 27.60ml. 7ml % % 0.073M 22.1 0.656 19.0 0.721 8 30.10ml 22.00ml. 8.1ml. % % 0.033M 17.2 0.764 15.3 0.815 9 13.30mL 4.50ml 8.8ml % % 0.057M 14.0 0.854 13.0 0.886 10 23.50ml 13.50ml 10mL % % 0.068M 10.8 0.967 10.6 0.975 11 34.50ml 23.50ml 11ml % % 0.075M 9.0% 1.046 8.6% 1.065 48.50ml 36.50ml. 12ml. 9 12
Step by Step Solution
There are 3 Steps involved in it

Get step-by-step solutions from verified subject matter experts