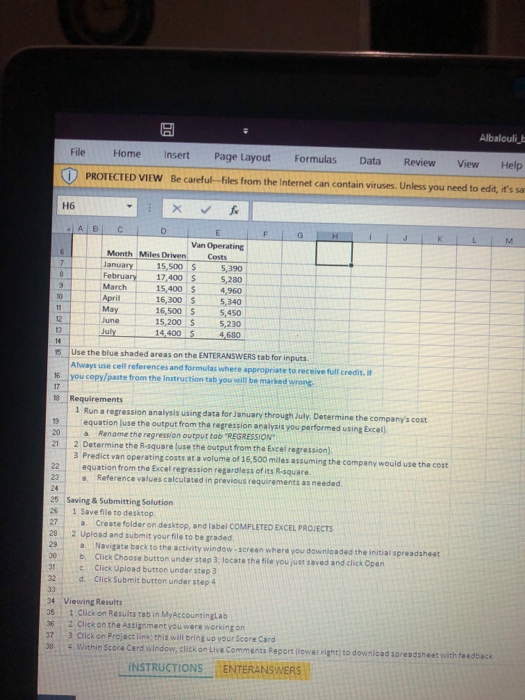
| | | Month | Miles Driven | Van Operating Costs | |
| | | January | 15,500 | $ 5,390 | |
| | | February | 17,400 | $ 5,280 | |
| | | March | 15,400 | $ 4,960 | |
| | | April | 16,300 | $ 5,340 | |
| | | May | 16,500 | $ 5,450 | |
| | | June | 15,200 | $ 5,230 | |
| | | July | 14,400 | $ 4,680 | |


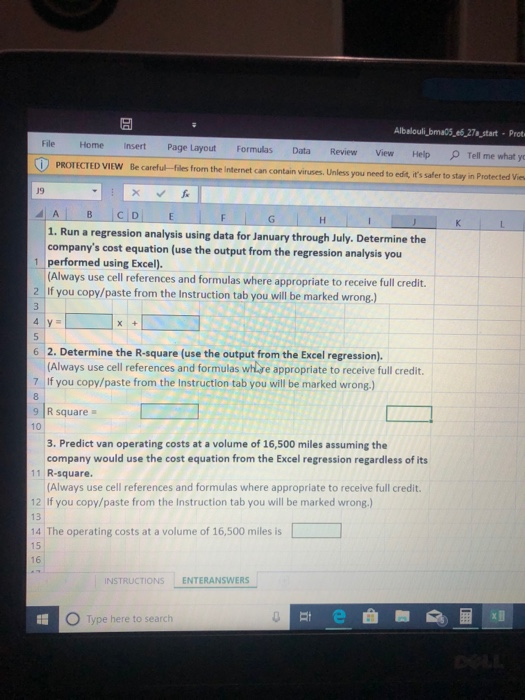
AlbaloulLbm456,27tart , prot File Home Insert Page Layout Formulas Data Review View Help Tell me what y PROTECTED VIEW Be carctu-fies from the internetcan contain vinues Unles you ned o eld t' sale tosy in Pratected M 19 1. Run a regression analysis using data for January through July. Determine the company's cost equation (use the output from the regression analysis you 1performed using Excel). (Always use cell references and formulas where appropriate to receive full credit 2 If you copy/paste from the Instruction tab you will be marked wrong.) 4 ya 6 2. Determine the R-square (use the output from the Excel regression). (Always use cell references and formulas whare appropriate to receive full credit 7 If you copy/paste from the Instruction tab you will be marked wrong.) 8 9 R square 10 3. Predict van operating costs at a volume of 16,500 miles assuming the company would use the cost equation from the Excel regression regardless of its 11 R-square. 12 If you copy/paste from the Instruction tab you will be marked wrong.) 14 The operating costs at a volume of 16,500 miles is (Always use cell references and formulas where appropriate to receive full credit. INSTRUCTIONS ENTERANSWERS Type here to search Albalouli h File Home Insert Page Layout Formulas Data Review View Help PROTECTED VIEW Be careful-files from the Internet can contain viruses. Unless you need to edit,it's sa H6 Van Operating Month Miles DrivenCosts 7January15,500 5,390 February 17,400 5,280 15,400 4960 16,300 5,340 16,500 5,450 15,200 5,230 4,680 March April 14,400 $ 15 Use the blue shaded areas on the ENTERANSWERS tab for inputs Always use cell references and formulas where appropriate to receive full credit. I 16 you copy/paste from the Instruction tab you will be marked wrong 17 _| Requirements 1 Run a regression analysis using data for January through July. Determine the company's cost equation (use the output from the regression analysis you performed using Excel). a Rename the regression output tab REGRESSION. 21 2 Determine the R-square luse the output from the Excel regression) 3 Predict van op erating costs at a volume of 16,500 miles assuming the company would use the cost 22 equation from the Excel regression regardless of its R-square 22 .. Reference values calculated in previous requirements as needed 25 Saving & Submitting Solution 26 1 5ave file to desktop 27 Create folder on desktop, and label COMPLETED EXCEL PROJECTS 28 2 Upload and submit your file to be graded 2 a. Navigate back to the activity window-screen where you downloaded the initial spreadsheet 0 b Click Choose button under step 3; locate the file you just saved and click Opan 31 c. Click Upload button under step 3 32 d. Click Submit button under step 4 4 Viewing Results 35 1 Click on Results tab in MyAccountinglab 6 2 Clickon the Assignment you were workingon 07 3 Click on Project link this will bring up your Score Card 4 Within Scare Card window, click on Live Comments Report lower right to download spreadzheet with feedback INSTRUCTIONS ENTERANSWERS


