

Answered step by step
Verified Expert Solution
Question
1 Approved Answer
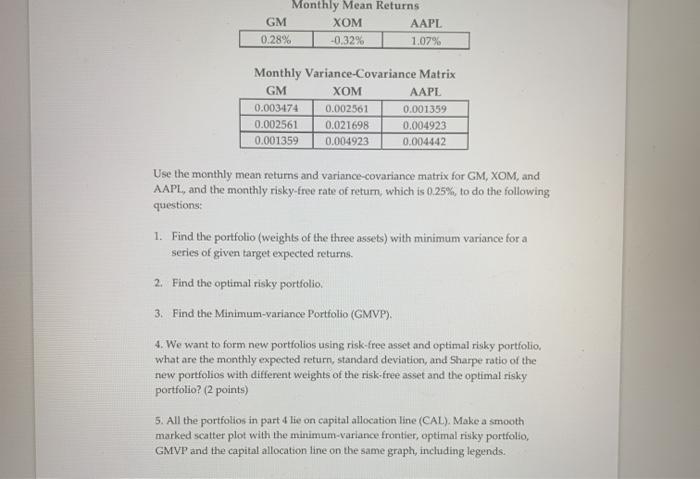
Monthly Mean Returns GM XOM AAPL 0.28% -0.32% 1.07% Monthly Variance-Covariance Matrix GM XOM AAPL 0.003474 0.002561 0.001359 0.002561 0.021698 0.004923 0.001359 0.004923 0.004442 Use
Step by Step Solution
There are 3 Steps involved in it
Step: 1

Get Instant Access to Expert-Tailored Solutions
See step-by-step solutions with expert insights and AI powered tools for academic success
Step: 2

Step: 3
Ace Your Homework with AI
Get the answers you need in no time with our AI-driven, step-by-step assistance
Get Started
Financial Markets And Institutions
Authors: Anthony Saunders, Marcia Cornett
5th Edition
0078034663, 978-0078034664