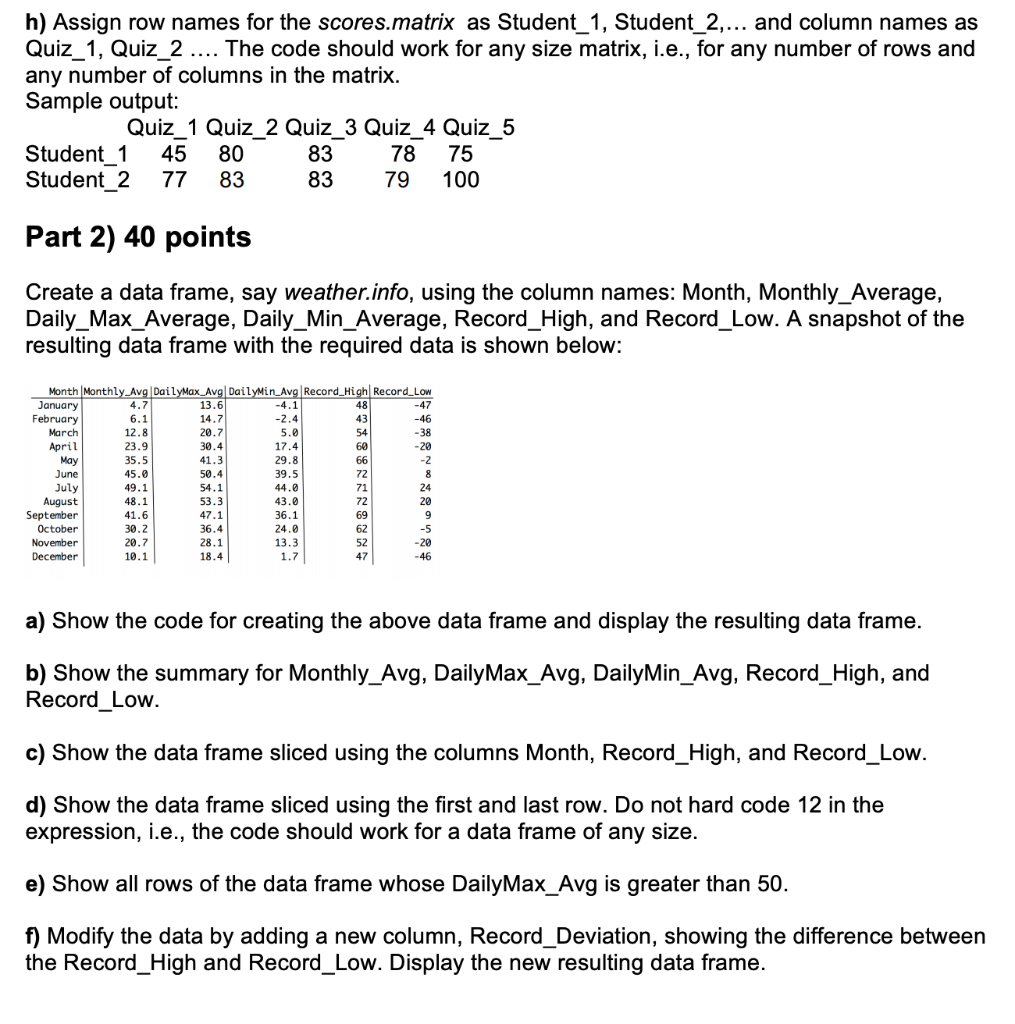


| | Monthly_Avg | DailyMax_Avg | DailyMin_Avg | Record_High | Record_Low |
| January | 4.7 | 13.6 | -4.1 | 48 | -47 |
| February | 6.1 | 14.7 | -2.4 | 43 | -46 |
| March | 12.8 | 20.7 | 5 | 54 | -38 |
| April | 23.9 | 30.4 | 17.4 | 60 | -20 |
| May | 35.5 | 41.3 | 29.8 | 66 | -2 |
| June | 45 | 50.4 | 39.5 | 72 | 8 |
| July | 49.1 | 54.1 | 44 | 71 | 24 |
| August | 48.1 | 53.3 | 43 | 72 | 20 |
| September | 41.6 | 47.1 | 36.1 | 69 | 9 |
| October | 30.2 | 36.4 | 24 | 62 | -5 |
| November | 20.7 | 28.1 | 13.3 | 52 | -20 |
| December | 10.1 | 18.4 | 1.7 | 47 | -46 |

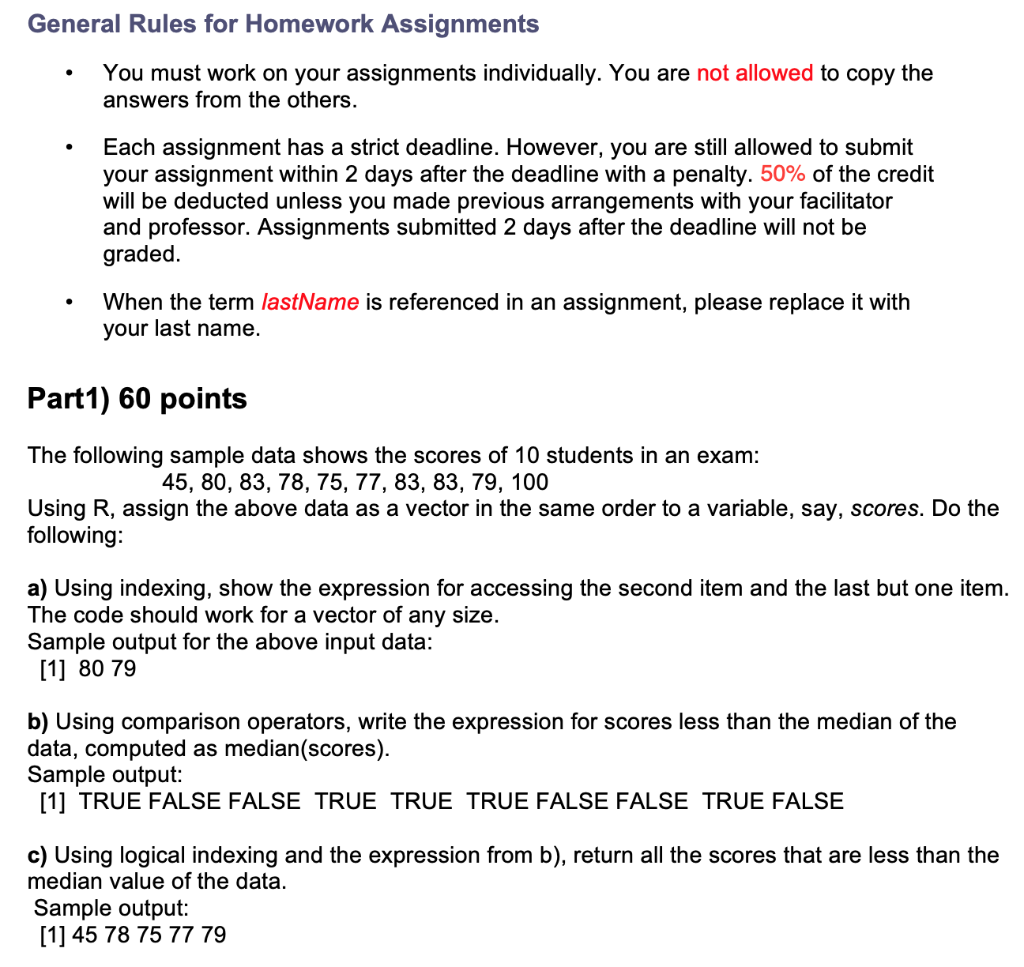
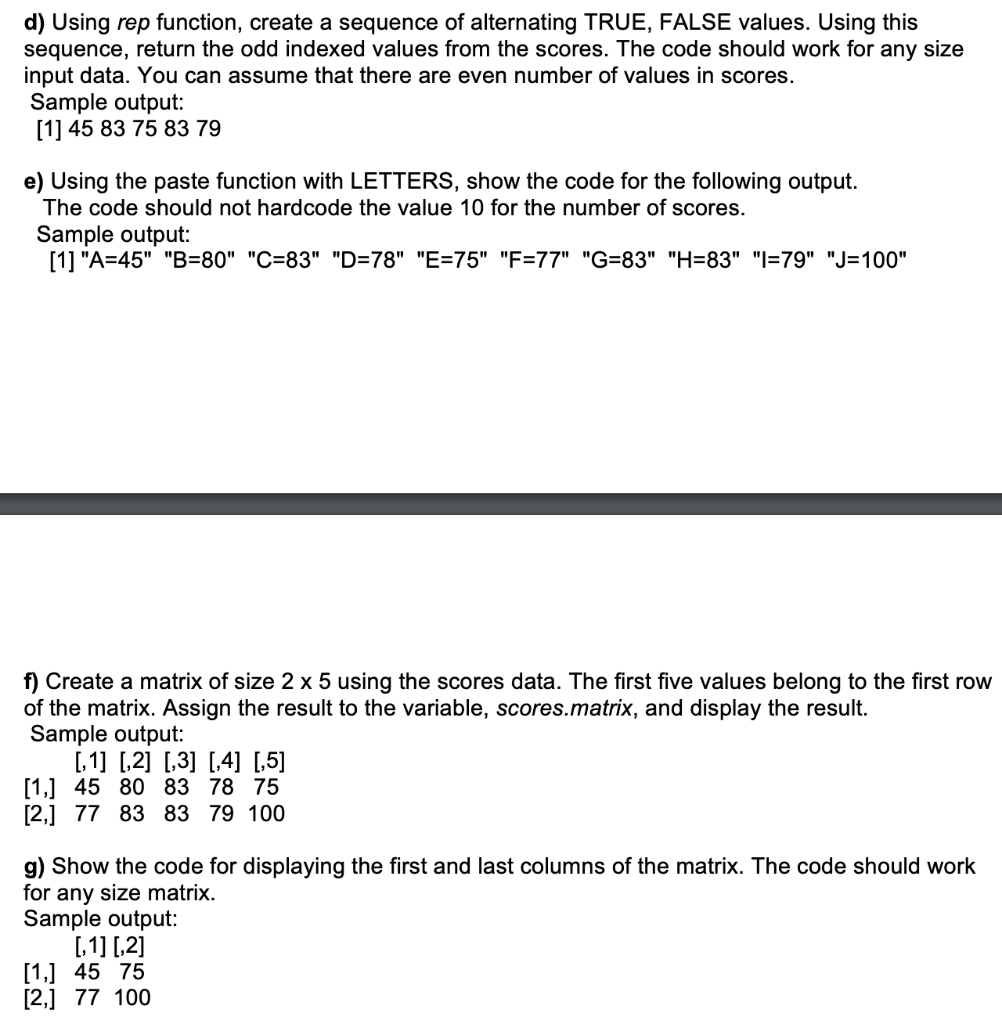
General Rules for Homework Assignments You must work on your assignments individually. You are not allowed to copy the answers from the others. Each assignment has a strict deadline. However, you are still allowed to submit your assignment within 2 days after the deadline with a penalty. 50% of the credit will be deducted unless you made previous arrangements with your facilitator and professor. Assignments submitted 2 days after the deadline will not be graded When the term lastName is referenced in an assignment, please replace it with your last name. Part1) 60 points The following sample data shows the scores of 10 students in an exam: 45, 80, 83, 78, 75, 77, 83, 83, 79, 100 Using R, assign the above data as a vector in the same order to a variable, say, scores. Do the following: a) Using indexing, show the expression for accessing the second item and the last but one item. The code should work for a vector of any size. Sample output for the above input data: [1] 80 79 b) Using comparison operators, write the expression for scores less than the median of the data, computed as median(scores). Sample output: [1] TRUE FALSE FALSE TRUE TRUE TRUE FALSE FALSE TRUE FALSE c) Using logical indexing and the expression from b), return all the scores that are less than the median value of the data. Sample output: [1] 45 78 75 77 79 d) Using rep function, create a sequence of alternating TRUE, FALSE values. Using this sequence, return the odd indexed values from the scores. The code should work for any size input data. You can assume that there are even number of values in scores. Sample output: [1] 45 83 75 83 79 e) Using the paste function with LETTERS, show the code for the following output. The code should not hardcode the value 10 for the number of scores. Sample output: [1] "A=45" "B=80" "C=83" "D=78" "E=75" "F=77" "G=83" "H=83" "I=79" "J=100" f) Create a matrix of size 2 x 5 using the scores data. The first five values belong to the first row of the matrix. Assign the result to the variable, scores.matrix, and display the result. Sample output: [1] [2] [,3] [,4] [,5] [1] 45 80 83 78 75 [2] 77 83 83 79 100 g) Show the code for displaying the first and last columns of the matrix. The code should work for any size matrix. Sample output: [,1] [,2] [1] 45 75 [2] 77 100 h) Assign row names for the scores.matrix as Student_1, Student_2,... and column names as Quiz 1, Quiz 2 .... The code should work for any size matrix, i.e., for any number of rows and any number of columns in the matrix. Sample output: Quiz_1 Quiz_2 Quiz_3 Quiz_4 Quiz_5 Student_1 45 80 83 78 75 Student_2 77 83 83 79 100 Part 2) 40 points Create a data frame, say weather.info, using the column names: Month, Monthly_Average, Daily_Max_Average, Daily_Min_Average, Record_High, and Record_Low. A snapshot of the resulting data frame with the required data is shown below: -47 14.7 20.7 Month Monthly Avg DailyMax_Avg DailyMin_Avg Record_High Record_LOW January 4.7 13.6 February 6.1 - 46 March 12.8 April 23.9 30.4 May 35.5 41.3 June 45.0 50.4 July 49.1 54.1 August 48.1 53.3 September 41.6 47.1 36.1 October 30.2 36.4 24.0 November 20.7 28.1 13.3 December 10.1 18.4 1.7 hoone a) Show the code for creating the above data frame and display the resulting data frame. b) Show the summary for Monthly_Avg, Daily Max_Avg, DailyMin_Avg, Record_High, and Record_Low. c) Show the data frame sliced using the columns Month, Record_High, and Record_Low. d) Show the data frame sliced using the first and last row. Do not hard code 12 in the expression, i.e., the code should work for a data frame of any size. e) Show all rows of the data frame whose DailyMax_Avg is greater than 50. f) Modify the data by adding a new column, Record_Deviation, showing the difference between the Record_High and Record_Low. Display the new resulting data frame. Submission: Create a folder, CS544_HW1_lastName and place the following files in this folder. Provide all R code in a single file, CS544_HW1_lastName.R. Clearly mark each subpart of each question and add appropriate comments. Archive the folder (CS544_HW1_lastName.zip). Upload the zip file to the Assignments section of Blackboard


