

Answered step by step
Verified Expert Solution
Question
1 Approved Answer
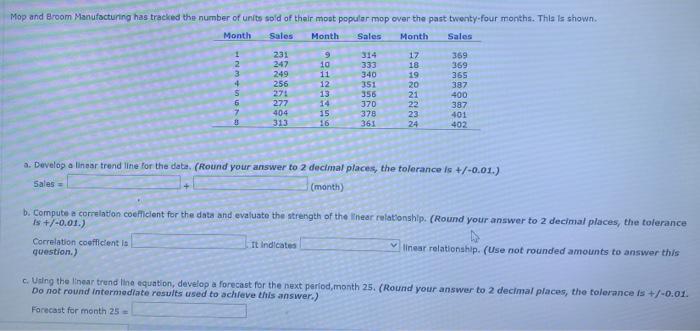
Mop and Broom Manufacturing has tracked the number of units sold of their most popular mop over the past twenty-four months. This is shown. Month
Step by Step Solution
There are 3 Steps involved in it
Step: 1

Get Instant Access to Expert-Tailored Solutions
See step-by-step solutions with expert insights and AI powered tools for academic success
Step: 2

Step: 3
Ace Your Homework with AI
Get the answers you need in no time with our AI-driven, step-by-step assistance
Get Started
Constraint Based Mining And Inductive Databases European Workshop On Inductive Databases And Constraint Based Mining Hinterzarten Germany March 2004 Revised Selected Papers Lnai 3848
Authors: Jean-Francois Boulicaut ,Luc De Raedt ,Heikki Mannila
2006th Edition
3540313311, 978-3540313311