

Answered step by step
Verified Expert Solution
Question
1 Approved Answer
MORGAN STANLEY Equity EQRV Related Functions Menu Message IMS US $ 147.625 +0.335 N47.62 47.63T 26 x 10 At 14:56 d Vol 4,592, 126 0
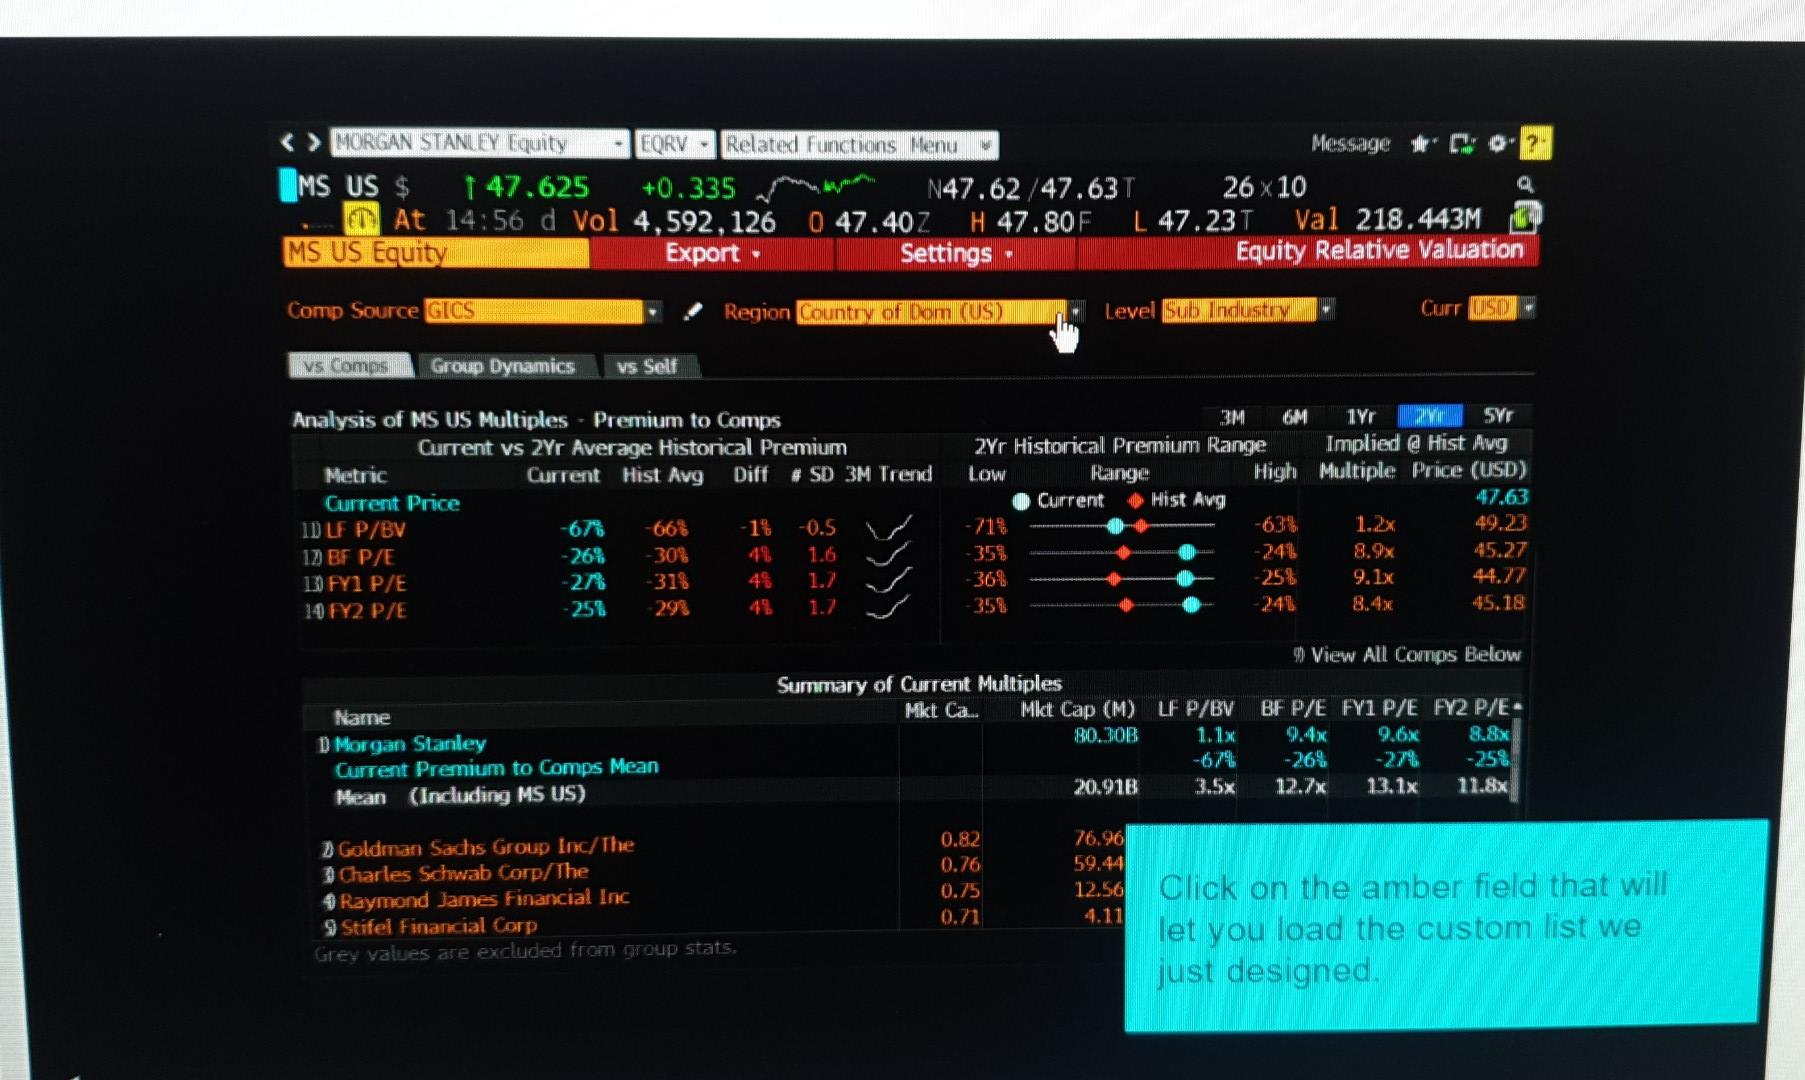
MORGAN STANLEY Equity EQRV Related Functions Menu Message IMS US $ 147.625 +0.335 N47.62 47.63T 26 x 10 At 14:56 d Vol 4,592, 126 0 47.40Z H 47.80F L 47.23 Val 218.443M MS US Equity Export Settings Equity Relative Valuation Comp Source GICS Region Country of Dom (US) Level Sub Industry Curr OSD vs Comes Group Dynamics vs Self Analysis of MS US Multiples - Premium to Comps 3M 6M 1Yr SYr Current vs 2Yr Average Historical Premium 2Yr Historical Premium Range Implied @ Hist Mug Metric Current Hist Avg Diff # SD 3M Trend LOW Range High Multiple Price (USD) Current Price Current Hist Avg 47.63 IDLE P/BV -67% -66% -1% -0.5 -71% -63% 1.2x 49.23 1. BF P/E -26% -30% 1.6 354 244 45.27 13 FY1 P/E -27% -31% 43 36% 25% 9.1x 44.77 14 FY2 P/E -25% 298 1.7 352 -241 8.43 45.18 1.7 View All Corps Below Summary of Current Multiples Mkt Ca... Mlct Cap (M) LF P/BV 80.30B 1.1X -674 20.91B 3.5x BF P/E FY1 P/E FY2 P/E- 9.6% 8.8% -26% -27% -258 12.7% 13.1x 11.8x Name D Morgan Stanley Current Premium to Comps Mean Mean (Including MS US) Goldman Sachs Group Inc/The Charles Schwab Corp/The 9 Raymond James Financial Inc Stifel Financial Corp Grey values are excluded from group stats. 0.82 0.76 0.75 0.71 26.96 59.44 12.56 4.11 Click on the amber field that will let you load the custom list we just designed MORGAN STANLEY Equity EQRV Related Functions Menu Message IMS US $ 147.625 +0.335 N47.62 47.63T 26 x 10 At 14:56 d Vol 4,592, 126 0 47.40Z H 47.80F L 47.23 Val 218.443M MS US Equity Export Settings Equity Relative Valuation Comp Source GICS Region Country of Dom (US) Level Sub Industry Curr OSD vs Comes Group Dynamics vs Self Analysis of MS US Multiples - Premium to Comps 3M 6M 1Yr SYr Current vs 2Yr Average Historical Premium 2Yr Historical Premium Range Implied @ Hist Mug Metric Current Hist Avg Diff # SD 3M Trend LOW Range High Multiple Price (USD) Current Price Current Hist Avg 47.63 IDLE P/BV -67% -66% -1% -0.5 -71% -63% 1.2x 49.23 1. BF P/E -26% -30% 1.6 354 244 45.27 13 FY1 P/E -27% -31% 43 36% 25% 9.1x 44.77 14 FY2 P/E -25% 298 1.7 352 -241 8.43 45.18 1.7 View All Corps Below Summary of Current Multiples Mkt Ca... Mlct Cap (M) LF P/BV 80.30B 1.1X -674 20.91B 3.5x BF P/E FY1 P/E FY2 P/E- 9.6% 8.8% -26% -27% -258 12.7% 13.1x 11.8x Name D Morgan Stanley Current Premium to Comps Mean Mean (Including MS US) Goldman Sachs Group Inc/The Charles Schwab Corp/The 9 Raymond James Financial Inc Stifel Financial Corp Grey values are excluded from group stats. 0.82 0.76 0.75 0.71 26.96 59.44 12.56 4.11 Click on the amber field that will let you load the custom list we just designed
Step by Step Solution
There are 3 Steps involved in it
Step: 1

Get Instant Access to Expert-Tailored Solutions
See step-by-step solutions with expert insights and AI powered tools for academic success
Step: 2

Step: 3
Ace Your Homework with AI
Get the answers you need in no time with our AI-driven, step-by-step assistance
Get Started
Benchmarking Islamic Finance
Authors: Mohd Ma'Sum Billah
1st Edition
0367546469, 978-0367546465