

Question
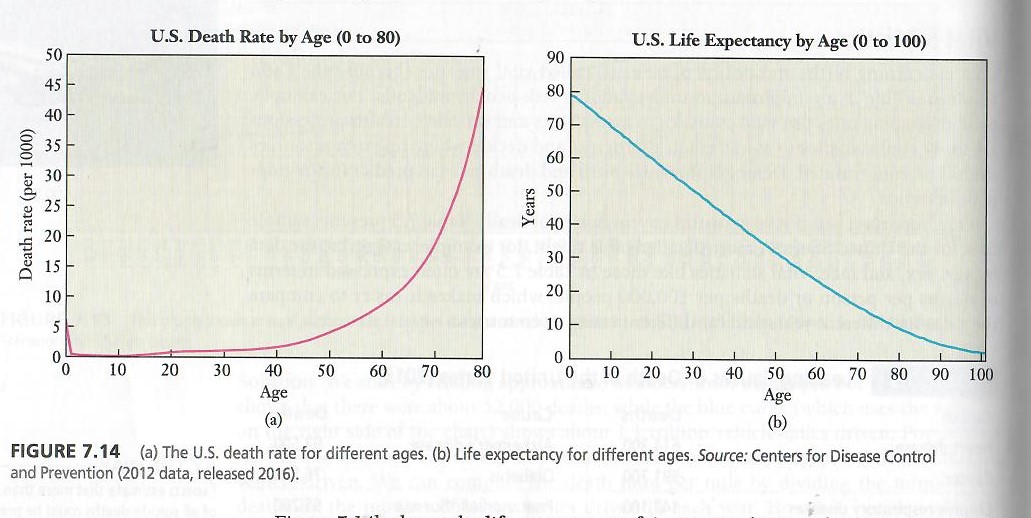
Mortality Rates. Use the graphs in figure 7.14 to answer the following questions. Estimate the death rate for 60- to 65- year-olds. Assuming there are
Mortality Rates. Use the graphs in figure 7.14 to answer the following questions.
Estimate the death rate for 60- to 65- year-olds. Assuming there are about 44 million 25- to 35-year-olds, how many people in this age bracket could be expected to die in a year.
The answer to this question is assuming a death rate of 11 per 1,000 approximately 156,200 deaths.
Please use short concise answers to solve this problem Please watch grammar, use good punctuation, etc. This is from Math 140 Statistics and Probability. Use clear writing that is easy to read. Attached is the graph to answer the problem Thank you very much.
Step by Step Solution
There are 3 Steps involved in it
Step: 1

Get Instant Access to Expert-Tailored Solutions
See step-by-step solutions with expert insights and AI powered tools for academic success
Step: 2

Step: 3
Ace Your Homework with AI
Get the answers you need in no time with our AI-driven, step-by-step assistance
Get Started
Beginning Algebra A Text/Workbook
Authors: Charles P McKeague
2nd Edition
1483271242, 9781483271248