

Answered step by step
Verified Expert Solution
Question
1 Approved Answer
Most Optimistic Time , Most Probable Time ,Most Pessimistic Time from the PDM diagram?. ta= Most optimistic time tm= Most probable time tb= Most pessimistic
Most Optimistic Time , Most Probable Time ,Most Pessimistic Time from the PDM diagram?.
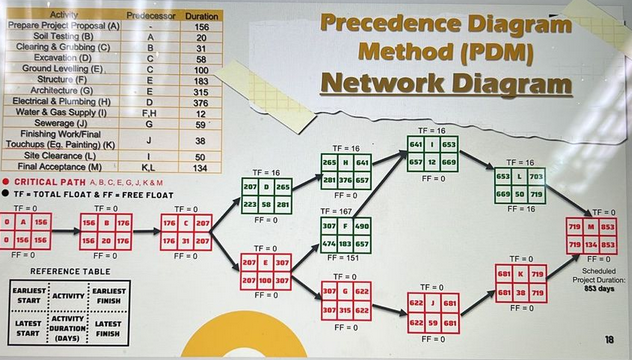
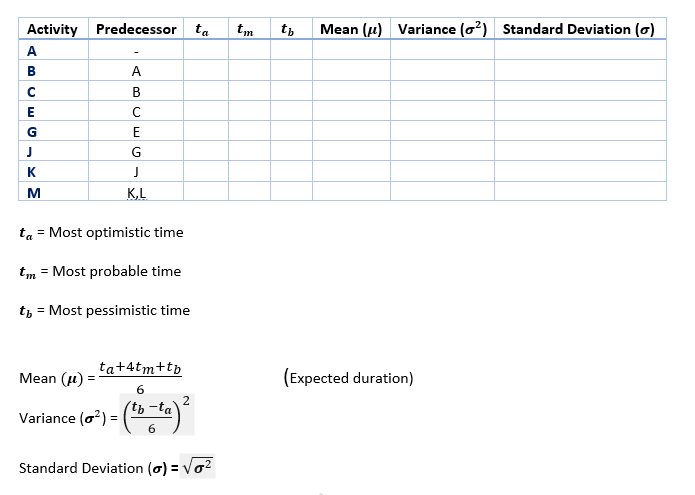
ta= Most optimistic time tm= Most probable time tb= Most pessimistic time Mean()=6ta+4tm+tb (Expected duration) Variance (2)=(6tbta)2 Standard Deviation ()=2 ta= Most optimistic time tm= Most probable time tb= Most pessimistic time Mean()=6ta+4tm+tb (Expected duration) Variance (2)=(6tbta)2 Standard Deviation ()=2
Step by Step Solution
There are 3 Steps involved in it
Step: 1

Get Instant Access to Expert-Tailored Solutions
See step-by-step solutions with expert insights and AI powered tools for academic success
Step: 2

Step: 3
Ace Your Homework with AI
Get the answers you need in no time with our AI-driven, step-by-step assistance
Get Started
Financial Accounting
Authors: David Perkins
4th Edition
111925700X, 978-1119257004