Motion in One Dimension - 1021 Welcome to the Physics Laboratory at Temple University! In this experiment, you are introduced to equipment and methods that
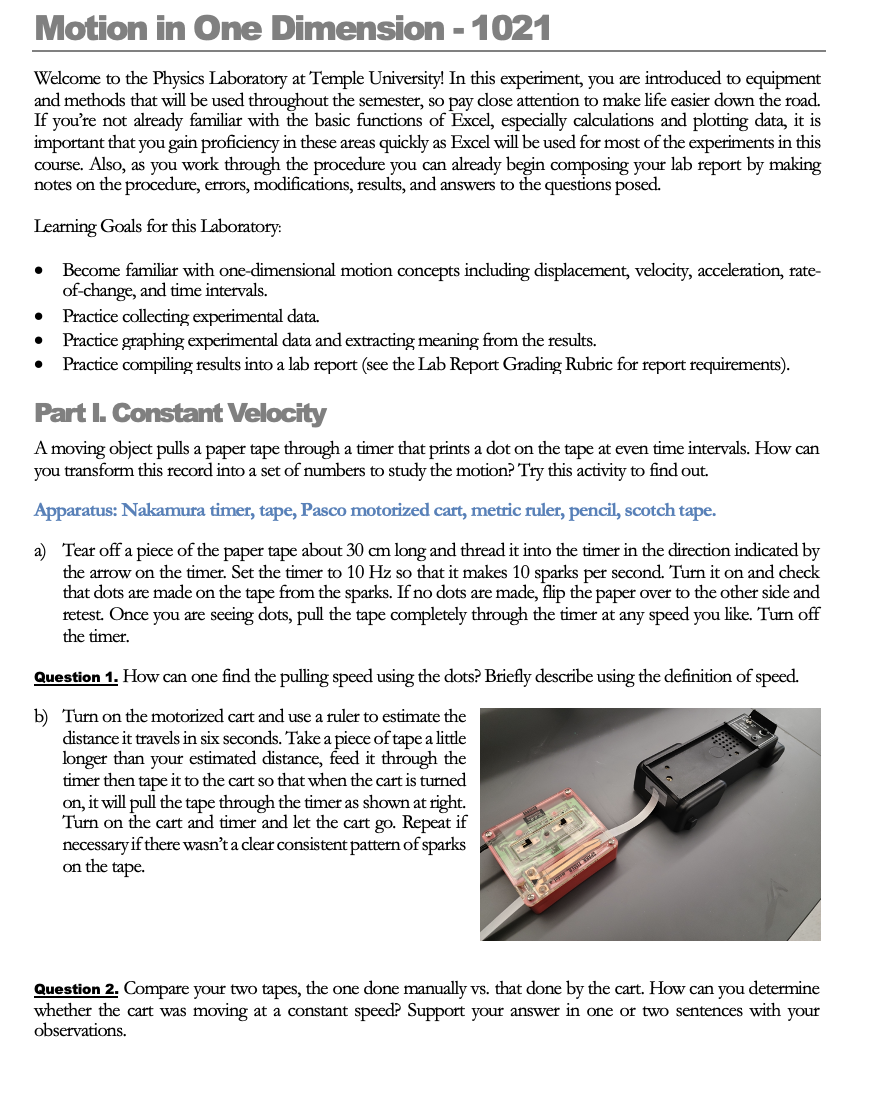
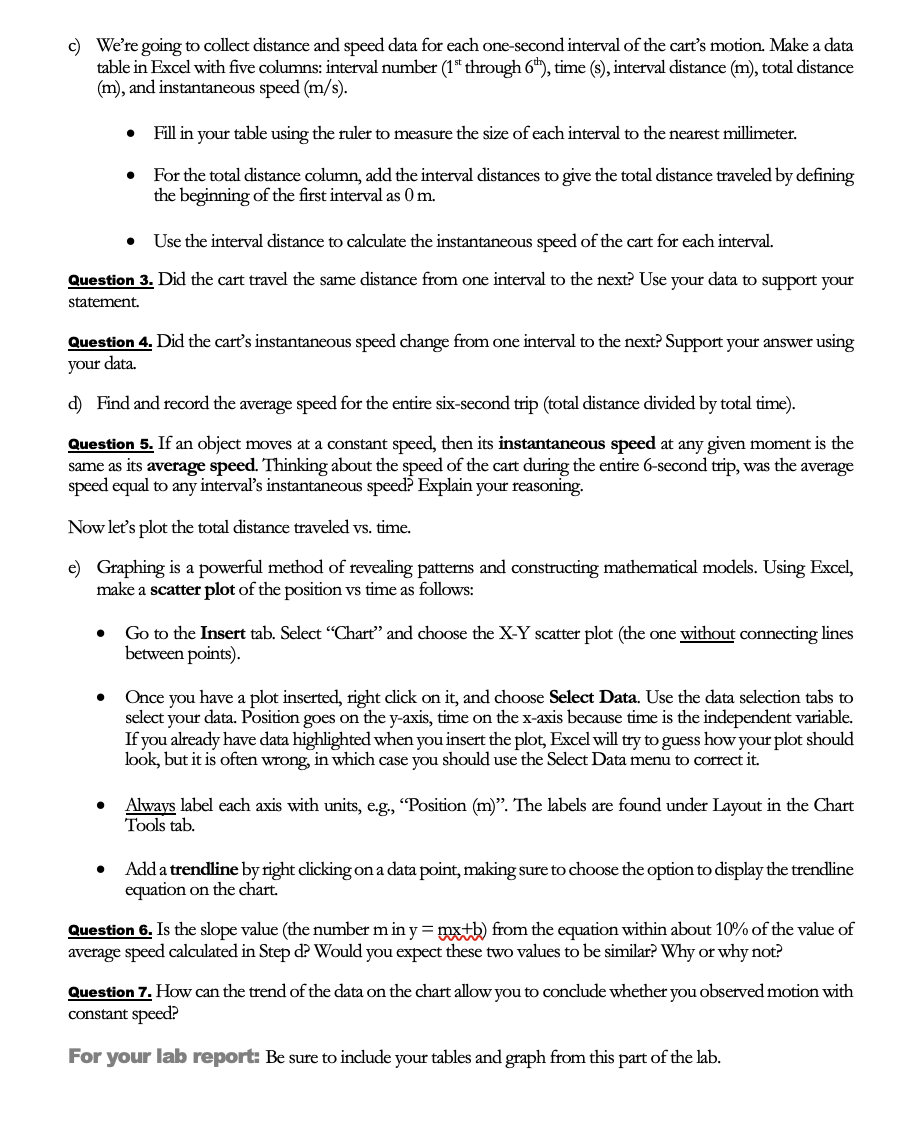
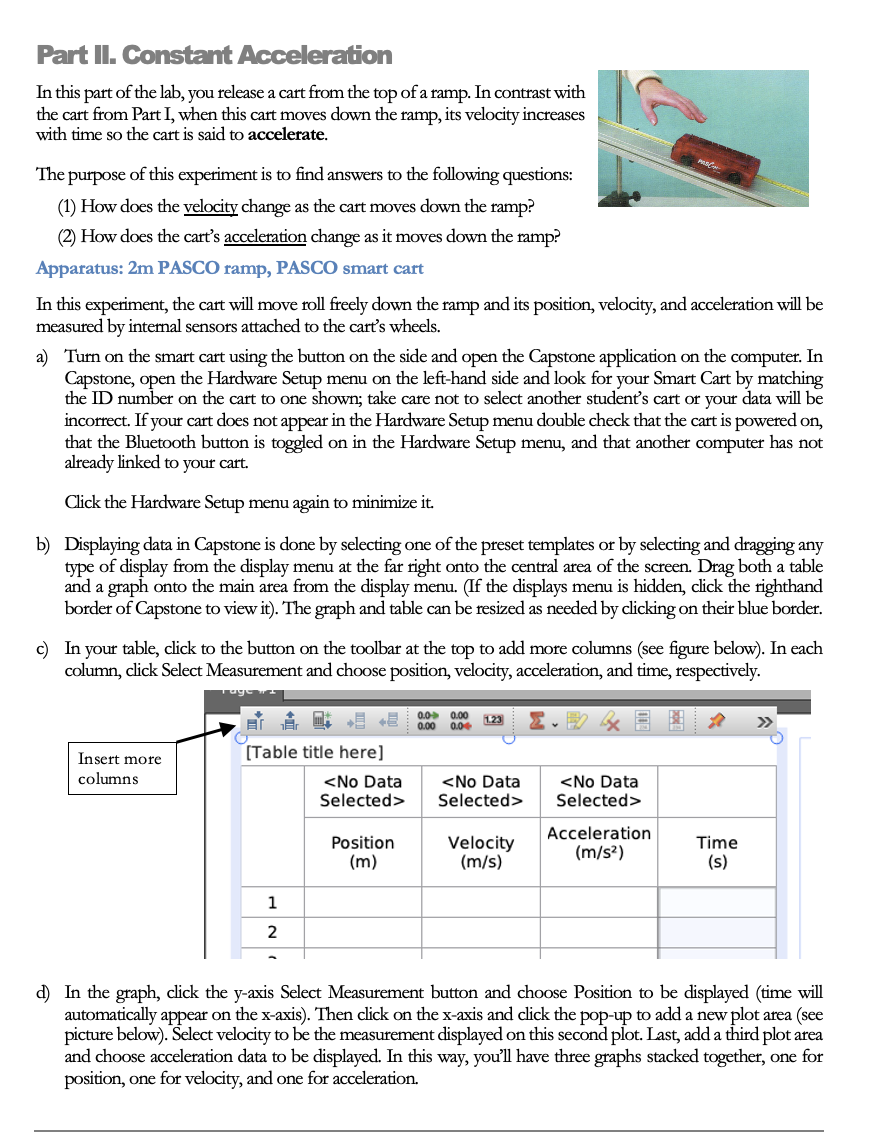
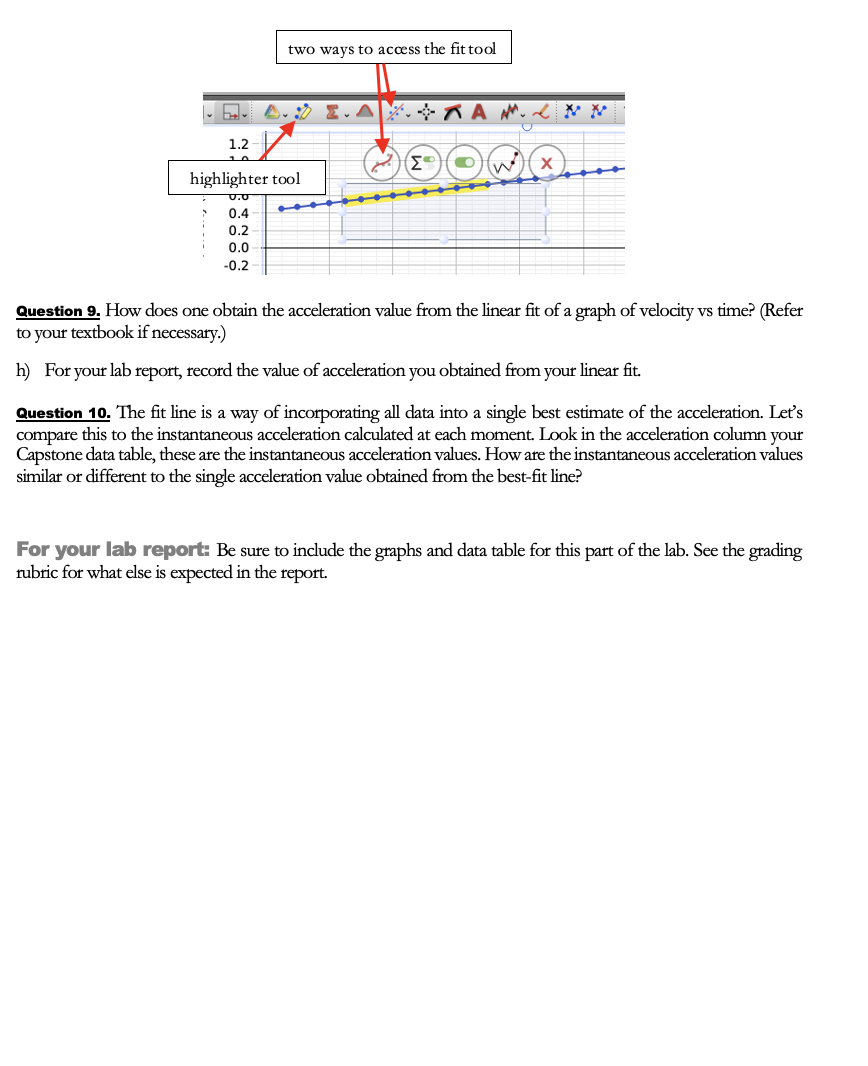
Motion in One Dimension - 1021 Welcome to the Physics Laboratory at Temple University! In this experiment, you are introduced to equipment and methods that will be used throughout the semester, so pay close attention to make life easier down the road. If you're not already familiar with the basic functions of Excel, especially calculations and plotting data, it is important that you gain proficiency in these areas quickly as Excel will be used for most of the experiments in this course. Also, as you work through the procedure you can already begin composing your lab report by making notes on the procedure, errors, modifications, results, and answers to the questions posed. Learning Goals for this Laboratory: Become familiar with one-dimensional motion concepts including displacement, velocity, acceleration, rate- of-change, and time intervals. . Practice collecting experimental data. . Practice graphing experimental data and extracting meaning from the results. . Practice compiling results into a lab report (see the Lab Report Grading Rubric for report requirements). Part I. Constant Velocity A moving object pulls a paper tape through a timer that prints a dot on the tape at even time intervals. How can you transform this record into a set of numbers to study the motion? Try this activity to find out. Apparatus: Nakamura timer, tape, Pasco motorized cart, metric ruler, pencil, scotch tape. Tear off a piece of the paper tape about 30 cm long and thread it into the timer in the direction indicated by the arrow on the timer. Set the timer to 10 Hz so that it makes 10 sparks per second. Turn it on and check that dots are made on the tape from the sparks. If no dots are made, flip the paper over to the other side and retest. Once you are seeing dots, pull the tape completely through the timer at any speed you like. Turn off the timer. Question 1. How can one find the pulling speed using the dots? Briefly describe using the definition of speed. ) Turn on the motorized cart and use a ruler to estimate the distance it travels in six seconds. Take a piece of tape a little longer than your estimated distance, feed it through the timer then tape it to the cart so that when the cart is turned on, it will pull the tape through the timer as shown at right. Turn on the cart and timer and let the cart go. Repeat if necessary if there wasn't a clear consistent pattern of sparks on the tape. Question 2. Compare your two tapes, the one done manually vs. that done by the cart. How can you determine whether the cart was moving at a constant speed? Support your answer in one or two sentences with your observations.c) We're going to collect distance and speed data for each one-second interval of the cart's motion. Make a data table in Excel with five columns: interval number (1st through 6*), time (s), interval distance (m), total distance (m), and instantaneous speed (m/s). . Fill in your table using the ruler to measure the size of each interval to the nearest millimeter. For the total distance column, add the interval distances to give the total distance traveled by defining the beginning of the first interval as 0 m. . Use the interval distance to calculate the instantaneous speed of the cart for each interval. Question 3. Did the cart travel the same distance from one interval to the next? Use your data to support your statement. Question 4. Did the cart's instantaneous speed change from one interval to the next? Support your answer using your data. 1) Find and record the average speed for the entire six-second trip (total distance divided by total time). Question 5. If an object moves at a constant speed, then its instantaneous speed at any given moment is the same as its average speed. Thinking about the speed of the cart during the entire 6-second trip, was the average speed equal to any interval's instantaneous speed? Explain your reasoning. Now let's plot the total distance traveled vs. time. e) Graphing is a powerful method of revealing patterns and constructing mathematical models. Using Excel, make a scatter plot of the position vs time as follows: Go to the Insert tab. Select "Chart" and choose the X-Y scatter plot (the one without connecting lines between points). Once you have a plot inserted, right click on it, and choose Select Data. Use the data selection tabs to select your data. Position goes on the y-axis, time on the x-axis because time is the independent variable. If you already have data highlighted when you insert the plot, Excel will try to guess how your plot should look, but it is often wrong, in which case you should use the Select Data menu to correct it. Always label each axis with units, e.g., "Position (m)". The labels are found under Layout in the Chart Tools tab. . Add a trendline by right clicking on a data point, making sure to choose the option to display the trendline equation on the chart. Question 6. Is the slope value (the number m in y = mx+) from the equation within about 10% of the value of average speed calculated in Step d? Would you expect these two values to be similar? Why or why not? Question 7. How can the trend of the data on the chart allow you to conclude whether you observed motion with constant speed? For your lab report: Be sure to include your tables and graph from this part of the lab.Part II. Constant Acceleration In this part of the lab, you release a cart from the top of a ramp. In contrast with the cart from Part I, when this cart moves down the ramp, its velocity increases with time so the cart is said to accelerate. The purpose of this experiment is to find answers to the following questions: (1) How does the velocity change as the cart moves down the ramp? (2) How does the cart's acceleration change as it moves down the ramp? Apparatus: 2m PASCO ramp, PASCO smart cart In this experiment, the cart will move roll freely down the ramp and its position, velocity, and acceleration will be measured by internal sensors attached to the cart's wheels. a) Turn on the smart cart using the button on the side and open the Capstone application on the computer. In Capstone, open the Hardware Setup menu on the left-hand side and look for your Smart Cart by matching the ID number on the cart to one shown; take care not to select another student's cart or your data will be incorrect. If your cart does not appear in the Hardware Setup menu double check that the cart is powered on, that the Bluetooth button is toggled on in the Hardware Setup menu, and that another computer has not already linked to your cart. Click the Hardware Setup menu again to minimize it. b) Displaying data in Capstone is done by selecting one of the preset templates or by selecting and dragging any type of display from the display menu at the far right onto the central area of the screen. Drag both a table and a graph onto the main area from the display menu. (If the displays menu is hidden, click the righthand border of Capstone to view it). The graph and table can be resized as needed by clicking on their blue border. c) In your table, click to the button on the toolbar at the top to add more columns (see figure below). In each column, click Select Measurement and choose position, velocity, acceleration, and time, respectively. Insert more [Table title here] columns Selected> Selected> Position Velocity Acceleration Time (m) (m/s) (m/s?) (s) 2 d) In the graph, click the y-axis Select Measurement button and choose Position to be displayed (time will automatically appear on the x-axis). Then click on the x-axis and click the pop-up to add a new plot area (see picture below). Select velocity to be the measurement displayed on this second plot. Last, add a third plot area and choose acceleration data to be displayed. In this way, you'll have three graphs stacked together, one for position, one for velocity, and one for acceleration.two ways to access the fit tool 1.2 highlighter tool 0.4 0.2 0.0 -0.2 Question 9. How does one obtain the acceleration value from the linear fit of a graph of velocity vs time? (Refer to your textbook if necessary.) h) For your lab report, record the value of acceleration you obtained from your linear fit. Question 10. The fit line is a way of incorporating all data into a single best estimate of the acceleration. Let's compare this to the instantaneous acceleration calculated at each moment. Look in the acceleration column your Capstone data table, these are the instantaneous acceleration values. How are the instantaneous acceleration values similar or different to the single acceleration value obtained from the best-fit line? For your lab report: Be sure to include the graphs and data table for this part of the lab. See the grading rubric for what else is expected in the report
Step by Step Solution
There are 3 Steps involved in it
Step: 1
Get Instant Access to Expert-Tailored Solutions
See step-by-step solutions with expert insights and AI powered tools for academic success
Step: 2
Step: 3
Ace Your Homework with AI
Get the answers you need in no time with our AI-driven, step-by-step assistance