Question
Ms. Leeshana found that the problem was not with the specific products kept in store but rather with the amounts ordered by Leader's procurement department.
Ms. Leeshana found that the problem was not with the specific products kept in store but rather with the amounts ordered by Leader's procurement department.
She was concerned that because the company had a large inventory of a few specific products, the prices would have to drop drastically, causing the company to lose money.
For the past two years, the company has presented a new product called the Leader. The leader was expected to have a major boost in demand following its release in 2020. The procurement team predicted demand for this item using the Trend Projection with Least Squares technique built with data from 2020.
They now appear to have an excess of inventory for this product.
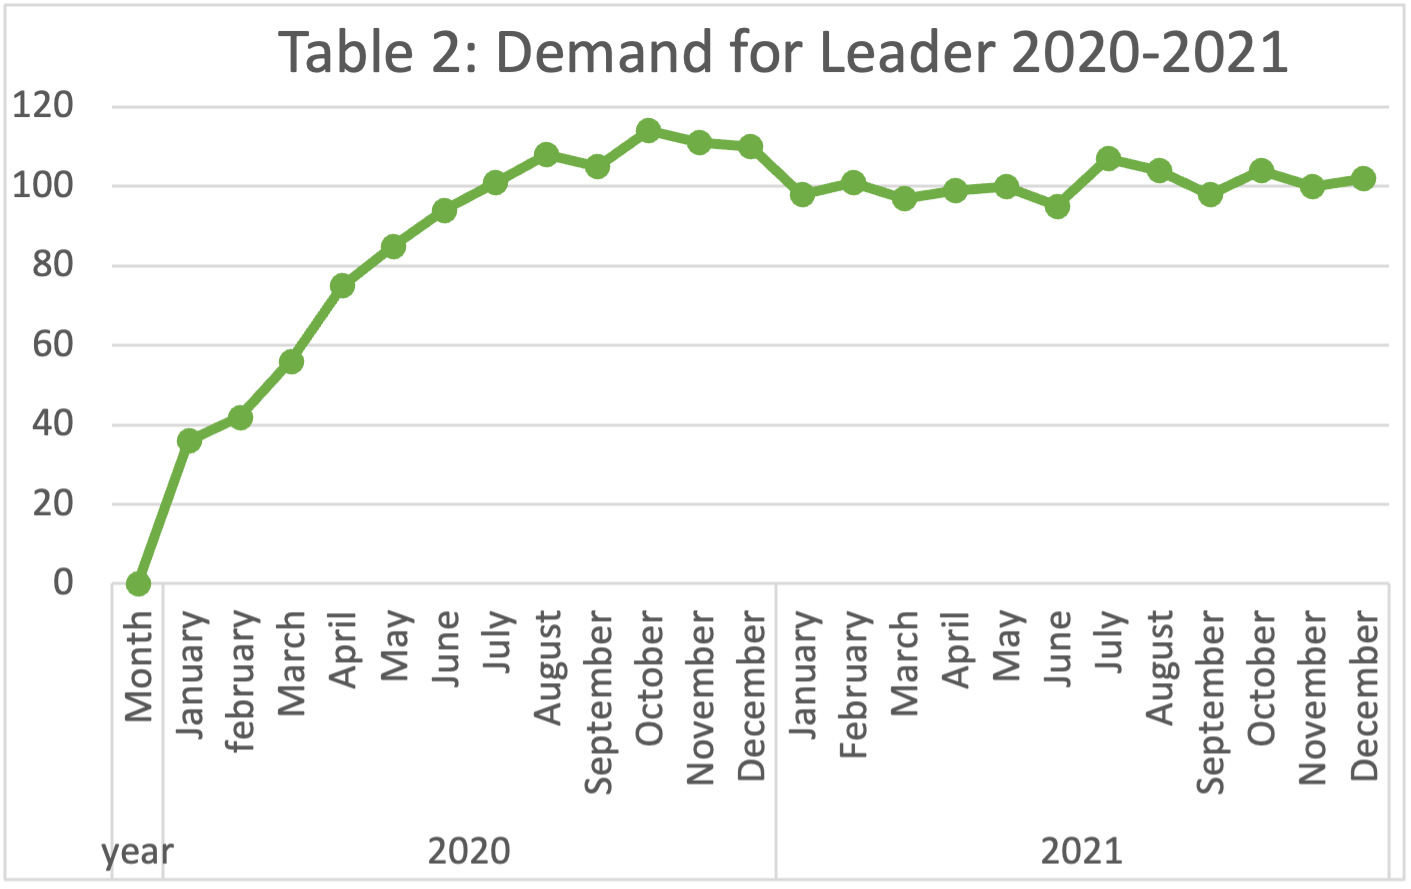
Table 2 displays the monthly demand information for this product during the previous two years.
table 2: Leader
| Month | Demand 2020 | Demand 2021 |
|
| January | 36 | 98 |
|
| february | 42 | 101 |
|
| March | 56 | 97 |
|
| April | 75 | 99 |
|
| May | 85 | 100 |
|
| June | 94 | 95 |
|
| July | 101 | 107 |
|
| August | 108 | 104 |
|
| September | 105 | 98 |
|
| October | 114 | 104 |
|
| November | 111 | 100 |
|
| December | 110 | 102 |
leader line graph:

I have structured and split the question in such a way to get more clear detail so please ANSWER ALL THE QUESTIONS IN DEPTH USING AT LEAST 150 WORDS FOR EACH QUESTION.
a. Since the quantities ordered by the procurement department were wrong, leading to the an excess inventory of Leader, the forecasting method used must have been wrong!
Elaborate and analyse why the Trend Projection with Least Squares technique was NOT the correct forecast method in this scenario.
b. What forecasting model would you employ to have the right quantities ordered by the procurement department? Elaborate and explain why did you choose your method?
c (i) Using the current model (Trend Projection with Least Squares technique). generate the forecast for each period in 2020 and 2021. Analyse the findings/results. SHOW YOUR EXCEL WORK/TABLE/FORMULA
c (ii) Using the model you chose in (b) generate the forecast for each period in 2020 and 2021. Analyse the findings/results. SHOW YOUR EXCEL WORK/TABLE/FORMULA
d. Obtain the forecast error for the chosen model and the current mode. Explain your approach and findings. SHOW YOUR EXCEL WORK/TABLE/FORMULA
e. Provide three key recommendations for the company.
ahle 2: Demand for I pader 20>02021
Step by Step Solution
There are 3 Steps involved in it
Step: 1

Get Instant Access to Expert-Tailored Solutions
See step-by-step solutions with expert insights and AI powered tools for academic success
Step: 2

Step: 3

Ace Your Homework with AI
Get the answers you need in no time with our AI-driven, step-by-step assistance
Get Started


