Answered step by step
Verified Expert Solution
Question
1 Approved Answer
Multilinear Regression Lab, will Leave thumbs for for complete answer!! Multilinear Regression using scikit-learn 1. Use the Boston dataset and the exploratory data analysis (EDA)
Multilinear Regression Lab, will Leave thumbs for for complete answer!!
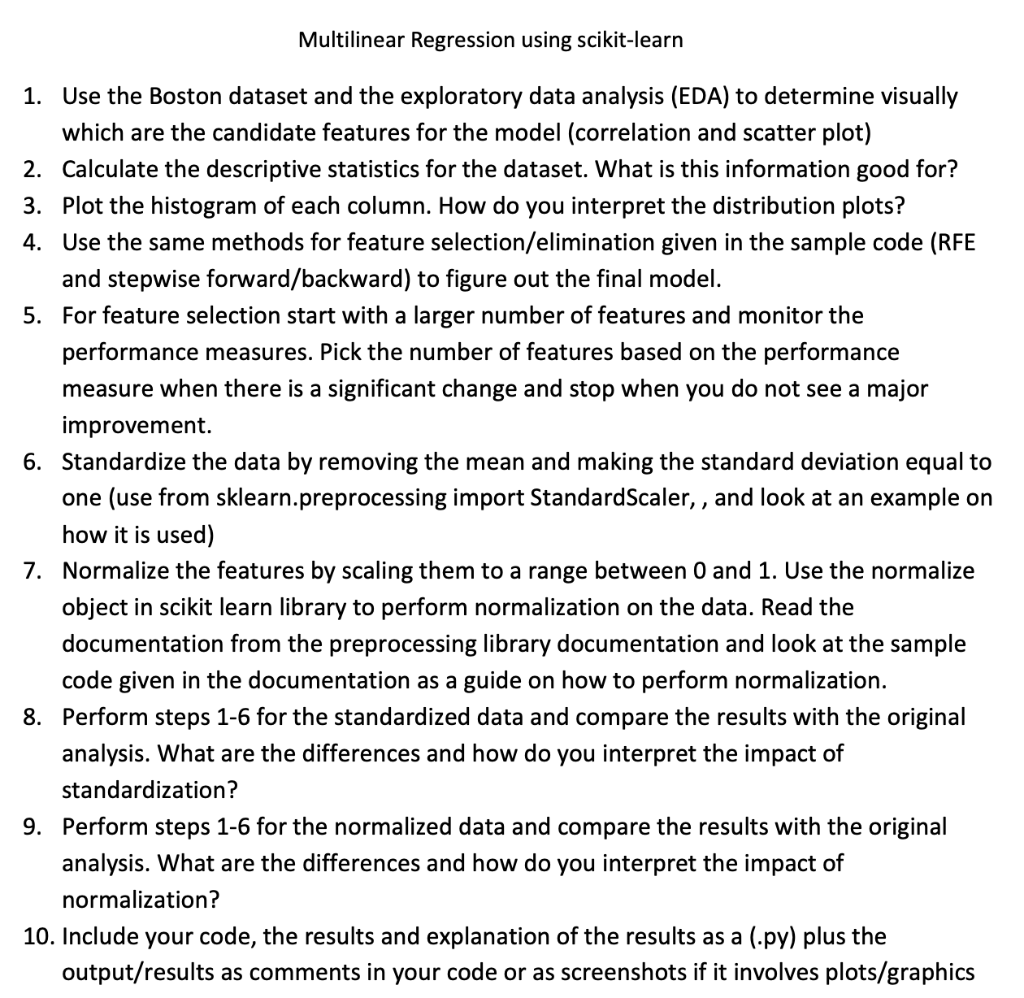
Multilinear Regression using scikit-learn 1. Use the Boston dataset and the exploratory data analysis (EDA) to determine visually which are the candidate features for the model (correlation and scatter plot) 2. Calculate the descriptive statistics for the dataset. What is this information good for? 3. Plot the histogram of each column. How do you interpret the distribution plots? 4. Use the same methods for feature selection/elimination given in the sample code (RFE and stepwise forward/backward) to figure out the final model. 5. For feature selection start with a larger number of features and monitor the performance measures. Pick the number of features based on the performance measure when there is a significant change and stop when you do not see a major improvement. 6. Standardize the data by removing the mean and making the standard deviation equal to one (use from sklearn.preprocessing import StandardScaler, , and look at an example on how it is used) 7. Normalize the features by scaling them to a range between 0 and 1 . Use the normalize object in scikit learn library to perform normalization on the data. Read the documentation from the preprocessing library documentation and look at the sample code given in the documentation as a guide on how to perform normalization. 8. Perform steps 1-6 for the standardized data and compare the results with the original analysis. What are the differences and how do you interpret the impact of standardization? 9. Perform steps 1-6 for the normalized data and compare the results with the original analysis. What are the differences and how do you interpret the impact of normalization? 10. Include your code, the results and explanation of the results as a (.py) plus the output/results as comments in your code or as screenshots if it involves plots/graphicsStep by Step Solution
There are 3 Steps involved in it
Step: 1
Get Instant Access to Expert-Tailored Solutions
See step-by-step solutions with expert insights and AI powered tools for academic success
Step: 2
Step: 3
Ace Your Homework with AI
Get the answers you need in no time with our AI-driven, step-by-step assistance
Get Started