must he done woth excel please help


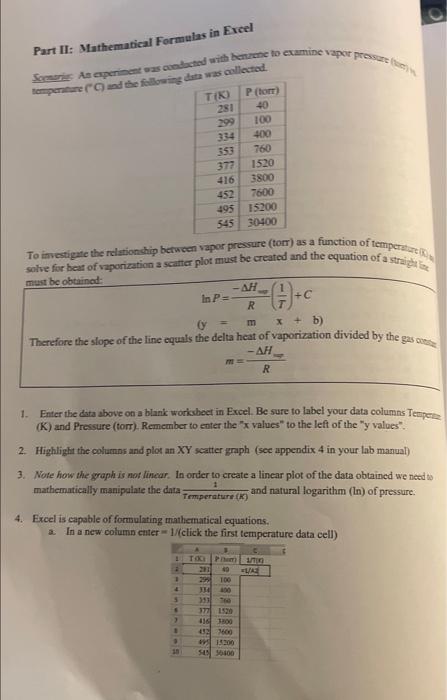
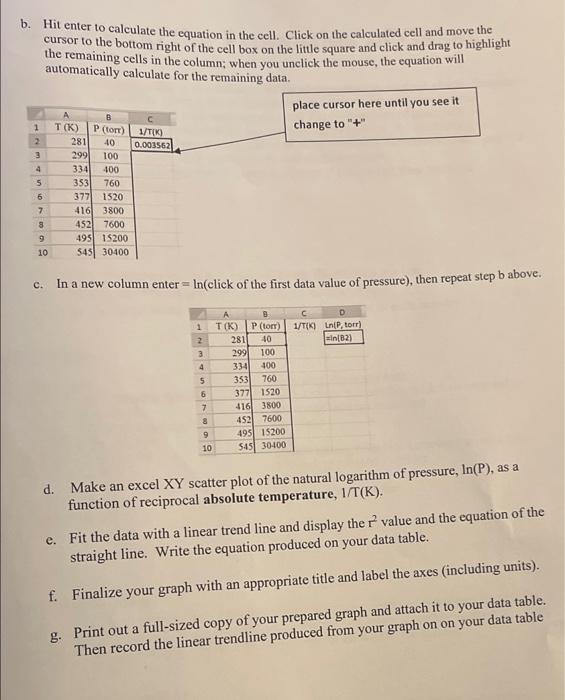
Part II: Mathematical Formulas in Excel So As opennent was conducted with benzene to examine vapor preso temperature following data was collected TIK) P (tor) 281 40 299 100 400 353 760 372 1520 416 3800 452 7600 495 15200 545 30400 To investigate the relationship between vapor pressure (tor) as a function of temper solve for heat of vaporization a scatter plot must be created and the equation of a stro must be obtained -AH In P= + R ly m + b) -()+c Therefore the slope of the line equals the delta heat of vaporization divided by the gas com . R 1. Enter the data above on a blank worksheet in Excel. Be sure to label your data columns Tempere (K) and Pressure (torr). Remember to enter the values to the left of the "y values". 2. Highlight the columns and plot an XY scatter graph (see appendix 4 in your lab manual) 3. Note how the graph is not linear. In order to create a linear plot of the data obtained we need to mathematically manipulate the data and natural logarithm (In) of pressure 4. Excel is capable of formulating mathematical equations. a In a new column enter - 1/click the first temperature data cell) 1 Temperature (K) C 1 TOO 21 LA 49 TOO 100 4 5 2 116 1200 1600 15200 50 100 10 b. Hit enter to calculate the equation in the cell. Click on the calculated cell and move the cursor to the bottom right of the cell box on the little square and click and drag to highlight the remaining cells in the column; when you unclick the mouse, the equation will automatically calculate for the remaining data. place cursor here until you see it P (tor) change to "+" 1 2 3 1/TIK) 0.003562 4 5 T(K) 281 40 299 100 334 100 353 760 377 1520 416 3800 7600 495 15200 543 30400 6 7 8 452 10 c. In a new column enter = ln(click of the first data value of pressure), then repeat step b above. 1 D 1/T LAIP, torr) in[B2) 2 3 4 B T(K) | P (to) 281 40 299 100 334 400 353 377 1920 4161 3800 452 7600 4951 15200 5451 30400 5 6 7 8 9 760 10 d. Make an excel XY scatter plot of the natural logarithm of pressure, In(P), as a function of reciprocal absolute temperature, 1/T(K), e. Fit the data with a linear trend line and display ther value and the equation of the straight line. Write the equation produced on your data table. f. Finalize your graph with an appropriate title and label the axes (including units). g. Print out a full-sized copy of your prepared graph and attach it to your data table. Then record the linear trendline produced from your graph on on your data table


