

Answered step by step
Verified Expert Solution
Question
1 Approved Answer
N. Post-Laboratory Assignment Begin a new identify each question by number. For quantitat wte tegibly. It is not necessary to copy the questions into your
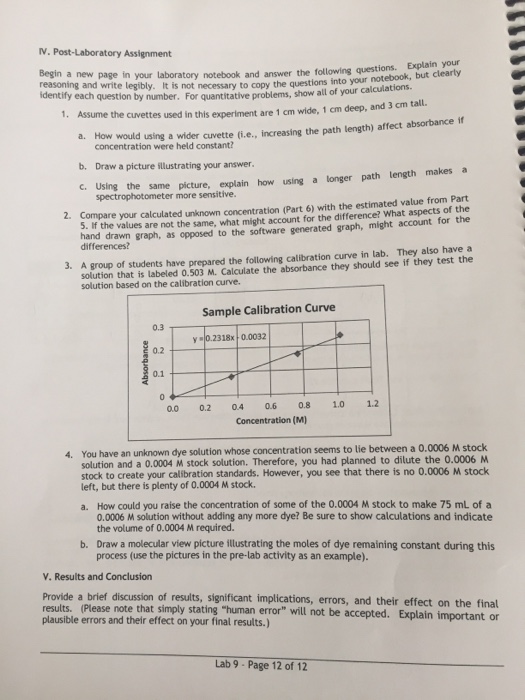 N. Post-Laboratory Assignment Begin a new identify each question by number. For quantitat wte tegibly. It is not necessary to copy the questions into your notebook, but clearty Assume the cuvettes used in this experiment are 1 cm wide, 1 deep, and 3 tall. a. How would using a wider cuvette (i.e., increasing the path length) affect absorbance if page in your laboratory notebook and answer the following questions. Explain your tive problems, show all of your calculations. concentration were held constant? b. Draw a picture illustrating your answer. c. Using the same picture, explain how using a longer path length makes a spectrophotometer more sensitive. Compare your calculated unknown concentration (Part 6) with the estimated value from Part 5. If the values are not the same, what might account for the difference? What aspects hand drawn graph, as opposed to the software generated graph, might account for the differences? of the 2. solution that is labeled 0.503 M. Calculate the absorbance they should see if they test the solution based on the calibration curve. 3. A group of students have prepared the following calibration curve in lab. They also have a Sample Calibration Curve 0.3 0.2 0.1 y0.2318x 0.0032 0.0 0.2 0.4 0.6 0.8 1.0 1.2 Concentration (M) You have an unknown dye solution whose concentration seems to lie between a 0.0006 M stock solution and a 0.0004 M stock solution. Therefore, you had planned to dilute the 0.0006 M stock to create your calibration standards. However, you see that there is no 0.0006 M stock left, but there is plenty of 0.0004 M stock. 4. How could you raise the concentration of some of the 0.0004 M stock to make 75 mL of a 0.0006 M solution without adding any more dye? Be sure to show calculations and indicate the volume of 0.0004 M required. a. Draw a molecular view picture illustrating the moles of dye remaining constant during this process (use the pictures in the pre-lab activity as an example). b. V. Results and Conclusion Provide a brief discussion of results, significant implications, errors, and their effect on the final results. (Please note that simply stating "human error" will not be accepted. Explain important or plausible errors and their effect on your final results.) Lab 9 Page 12 of 12 N. Post-Laboratory Assignment Begin a new identify each question by number. For quantitat wte tegibly. It is not necessary to copy the questions into your notebook, but clearty Assume the cuvettes used in this experiment are 1 cm wide, 1 deep, and 3 tall. a. How would using a wider cuvette (i.e., increasing the path length) affect absorbance if page in your laboratory notebook and answer the following questions. Explain your tive problems, show all of your calculations. concentration were held constant? b. Draw a picture illustrating your answer. c. Using the same picture, explain how using a longer path length makes a spectrophotometer more sensitive. Compare your calculated unknown concentration (Part 6) with the estimated value from Part 5. If the values are not the same, what might account for the difference? What aspects hand drawn graph, as opposed to the software generated graph, might account for the differences? of the 2. solution that is labeled 0.503 M. Calculate the absorbance they should see if they test the solution based on the calibration curve. 3. A group of students have prepared the following calibration curve in lab. They also have a Sample Calibration Curve 0.3 0.2 0.1 y0.2318x 0.0032 0.0 0.2 0.4 0.6 0.8 1.0 1.2 Concentration (M) You have an unknown dye solution whose concentration seems to lie between a 0.0006 M stock solution and a 0.0004 M stock solution. Therefore, you had planned to dilute the 0.0006 M stock to create your calibration standards. However, you see that there is no 0.0006 M stock left, but there is plenty of 0.0004 M stock. 4. How could you raise the concentration of some of the 0.0004 M stock to make 75 mL of a 0.0006 M solution without adding any more dye? Be sure to show calculations and indicate the volume of 0.0004 M required. a. Draw a molecular view picture illustrating the moles of dye remaining constant during this process (use the pictures in the pre-lab activity as an example). b. V. Results and Conclusion Provide a brief discussion of results, significant implications, errors, and their effect on the final results. (Please note that simply stating "human error" will not be accepted. Explain important or plausible errors and their effect on your final results.) Lab 9 Page 12 of 12
Step by Step Solution
There are 3 Steps involved in it
Step: 1

Get Instant Access to Expert-Tailored Solutions
See step-by-step solutions with expert insights and AI powered tools for academic success
Step: 2

Step: 3
Ace Your Homework with AI
Get the answers you need in no time with our AI-driven, step-by-step assistance
Get Started
Datacasting How To Stream Databases Over The Internet
Authors: Jessica Keyes
1st Edition
007034678X, 978-0070346789