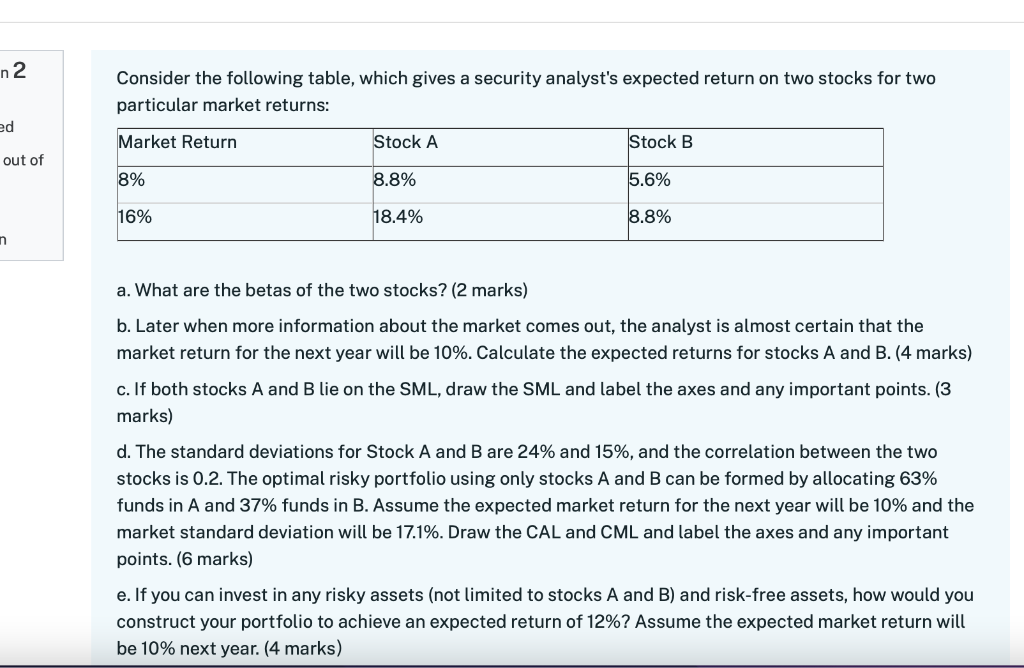
n2 Consider the following table, which gives a security analyst's expected return on two stocks for two particular market returns: ed Market Return Stock A Stock B out of 8% 8.8% 5.6% 16% 18.4% 8.8% n a. What are the betas of the two stocks? (2 marks) b. Later when more information about the market comes out, the analyst is almost certain that the market return for the next year will be 10%. Calculate the expected returns for stocks A and B. (4 marks) c. If both stocks A and B lie on the SML, draw the SML and label the axes and any important points. (3 marks) d. The standard deviations for Stock A and B are 24% and 15%, and the correlation between the two stocks is 0.2. The optimal risky portfolio using only stocks A and B can be formed by allocating 63% funds in A and 37% funds in B. Assume the expected market return for the next year will be 10% and the market standard deviation will be 17.1%. Draw the CAL and CML and label the axes and any important points. (6 marks) e. If you can invest in any risky assets (not limited to stocks A and B) and risk-free assets, how would you construct your portfolio to achieve an expected return of 12%? Assume the expected market return will be 10% next year. (4 marks) n2 Consider the following table, which gives a security analyst's expected return on two stocks for two particular market returns: ed Market Return Stock A Stock B out of 8% 8.8% 5.6% 16% 18.4% 8.8% n a. What are the betas of the two stocks? (2 marks) b. Later when more information about the market comes out, the analyst is almost certain that the market return for the next year will be 10%. Calculate the expected returns for stocks A and B. (4 marks) c. If both stocks A and B lie on the SML, draw the SML and label the axes and any important points. (3 marks) d. The standard deviations for Stock A and B are 24% and 15%, and the correlation between the two stocks is 0.2. The optimal risky portfolio using only stocks A and B can be formed by allocating 63% funds in A and 37% funds in B. Assume the expected market return for the next year will be 10% and the market standard deviation will be 17.1%. Draw the CAL and CML and label the axes and any important points. (6 marks) e. If you can invest in any risky assets (not limited to stocks A and B) and risk-free assets, how would you construct your portfolio to achieve an expected return of 12%? Assume the expected market return will be 10% next year. (4 marks)


