

Answered step by step
Verified Expert Solution
Question
1 Approved Answer
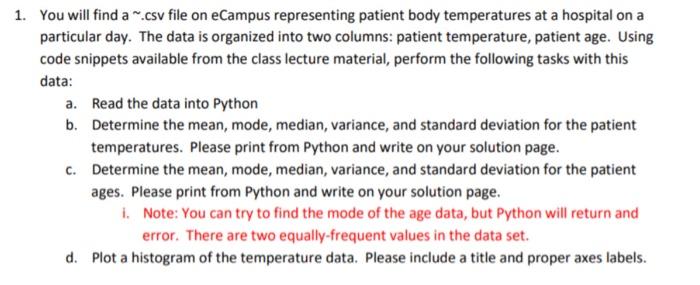
Name of the csv file: PatientTemperature 96.3,70 96.7,71 96.9,74 97,80 97.1,73 97.1,75 97.1,82 97.2,64 97.3,69 97.4,70 97.4,68 97.4,72 97.4,78 97.5,70 97.5,75 97.6,74 97.6,69 97.6,73 97.7,77
Name of the csv file: PatientTemperature
96.3,70
96.7,71
96.9,74
97,80
97.1,73
97.1,75
97.1,82
97.2,64
97.3,69
97.4,70
97.4,68
97.4,72
97.4,78
97.5,70
97.5,75
97.6,74
97.6,69
97.6,73
97.7,77
97.8,58
97.8,73
97.8,65
97.8,74
97.9,76
97.9,72
98,78
98,71
98,74
98,67
98,64
98,78
98.1,73
98.1,67
98.2,66
98.2,64
98.2,71
98.2,72
98.3,86
98.3,72
98.4,68
98.4,70
98.4,82
98.4,84
98.5,68
98.5,71
98.6,77
98.6,78
98.6,83
98.6,66
98.6,70
98.6,82
98.7,73
98.7,78
98.8,78
98.8,81
98.8,78
98.9,80
99,75
99,79
99,81
99.1,71
99.2,83
99.3,63
99.4,70
99.5,75
96.4,69
96.7,62
96.8,75
97.2,66
97.2,68
97.4,57
97.6,61
97.7,84
97.7,61
97.8,77
97.8,62
97.8,71
97.9,68
97.9,69
97.9,79
98,76
98,87
98,78
98,73
98,89
98.1,81
98.2,73
98.2,64
98.2,65
98.2,73
98.2,69
98.2,57
98.3,79
98.3,78
98.3,80
98.4,79
98.4,81
98.4,73
98.4,74
98.4,84
98.5,83
98.6,82
98.6,85
98.6,86
98.6,77
98.7,72
98.7,79
98.7,59
98.7,64
98.7,65
98.7,82
98.8,64
98.8,70
98.8,83
98.8,89
98.8,69
98.8,73
98.8,84
98.9,76
99,79
99,81
99.1,80
99.1,74
99.2,77
99.2,66
99.3,68
99.4,77
99.9,79
100,78
100.8,77
Step by Step Solution
There are 3 Steps involved in it
Step: 1

Get Instant Access to Expert-Tailored Solutions
See step-by-step solutions with expert insights and AI powered tools for academic success
Step: 2

Step: 3
Ace Your Homework with AI
Get the answers you need in no time with our AI-driven, step-by-step assistance
Get Started
Time Series Databases New Ways To Store And Access Data
Authors: Ted Dunning, Ellen Friedman
1st Edition
1491914726, 978-1491914724