

Answered step by step
Verified Expert Solution
Question
1 Approved Answer
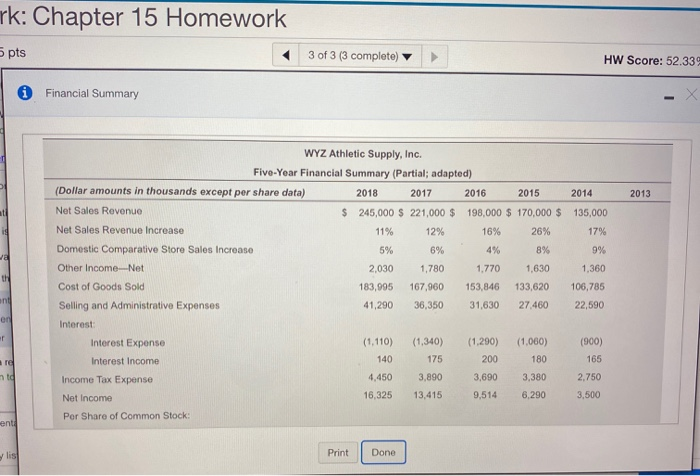
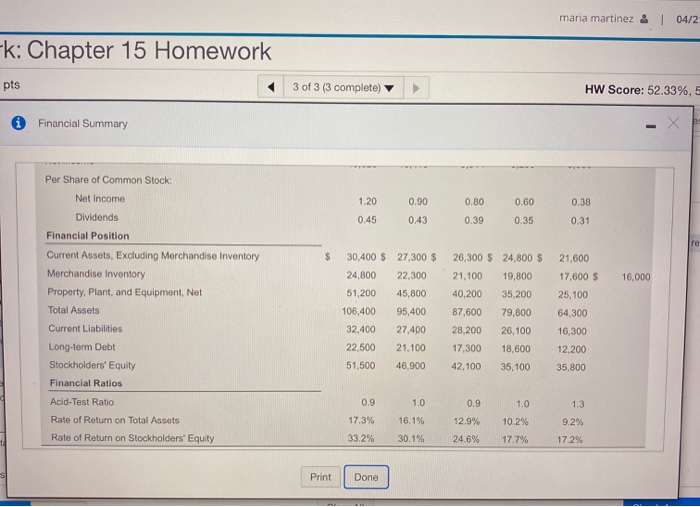
ne profit margin ratio, return on assets, and retum on equity are increasing arnings per share is increasing over time so the stock is attractive

Step by Step Solution
There are 3 Steps involved in it
Step: 1

Get Instant Access to Expert-Tailored Solutions
See step-by-step solutions with expert insights and AI powered tools for academic success
Step: 2

Step: 3
Ace Your Homework with AI
Get the answers you need in no time with our AI-driven, step-by-step assistance
Get Started
Financial Accounting and Reporting
Authors: Barry Elliott, Jamie Elliott
14th Edition
978-0273744535, 273744445, 273744534, 978-0273744443