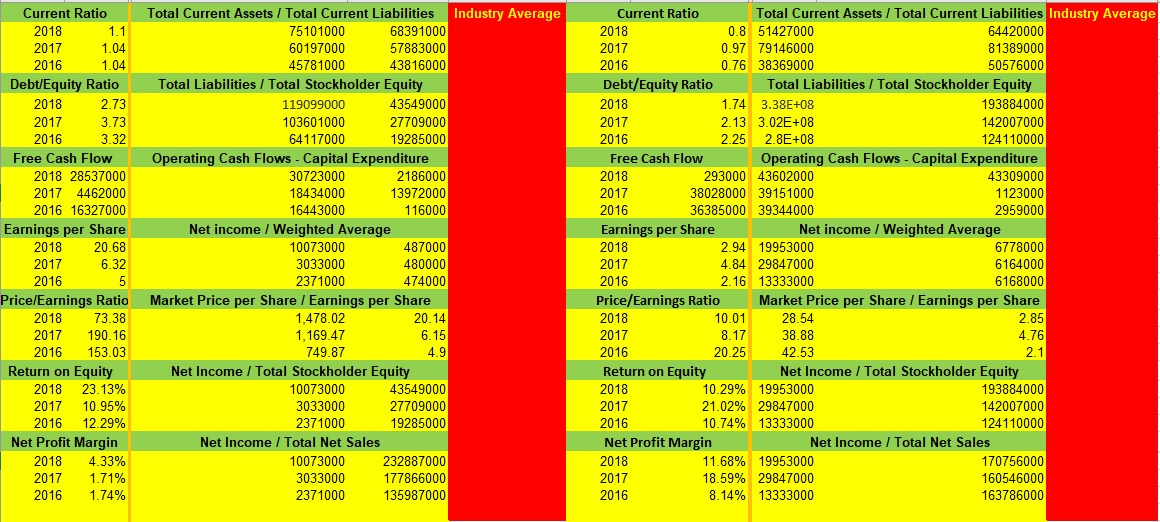
Need 3 year industry averages for the following financial calculations:
Current Ratio Debt/Equity Ratio Free Cash Flow Earnings per Share Price/Earnings Ratio Return on Equity Net Profit Margin

Current Ratio 2018 1.1 2017 1.04 2016 1.04 Debt/Equity Ratio 2018 2.73 2017 3.73 2016 3.32 Free Cash Flow 2018 28537000 2017 4462000 2016 16327000 Earnings per Share 2018 20.68 6.32 2016 Price/Earnings Ratio 2018 73.38 2017 190.16 2016 153.03 Return on Equity 2018 23.13% 2017 10.95% 2016 12.29% Net Profit Margin 2018 4.33% 2017 1.71% 2016 1.74% Total Current Assets/Total Current Liabilities Industry Average 75101000 68391000 60197000 57883000 45781000 43816000 Total Liabilities / Total Stockholder Equity 119099000 43549000 103601000 27709000 64117000 19285000 Operating Cash Flows - Capital Expenditure 30723000 2186000 18434000 13972000 16443000 116000 Net income / Weighted Average 10073000 487000 3033000 480000 2371000 474000 Market Price per Share / Earnings per Share 1,478.02 20.14 1,169.47 749.87 4.9 Net Income / Total Stockholder Equity 10073000 43549000 3033000 27709000 2371000 19285000 Net Income / Total Net Sales 10073000 232887000 3033000 177866000 2371000 135987000 Current Ratio Total Current Assets/Total Current Liabilities Industry Average 2018 0.8 51427000 64420000 2017 0.97 79146000 81389000 2016 0.76 38369000 50576000 Debt/Equity Ratio Total Liabilities/Total Stockholder Equity 2018 1.74 3.38E+08 193884000 2017 2.13 3.02E+08 142007000 2016 2.25 2.8E+08 124110000 Free Cash Flow Operating Cash Flows - Capital Expenditure 2018 293000 43602000 43309000 2017 38028000 39151000 1123000 2016 36385000 39344000 2959000 Earnings per Share Net income /Weighted Average 2018 2.94 19953000 6778000 2017 4.84 29847000 6164000 2016 2.16 13333000 6168000 Price/Earnings Ratio Market Price per Share / Earnings per Share 2018 10.01 28.54 2.85 2017 8.17 38.88 4.76 2016 20.25 42.53 Return on Equity Net Income / Total Stockholder Equity 2018 10.29% 19953000 193884000 2017 21.02% 29847000 142007000 2016 10.74% 13333000 124110000 Net Profit Margin Net Income / Total Net Sales 2018 11.68% 19953000 170756000 2017 18.59% 29847000 160546000 2016 8.14% 13333000 163786000 6.15 2.1 Current Ratio 2018 1.1 2017 1.04 2016 1.04 Debt/Equity Ratio 2018 2.73 2017 3.73 2016 3.32 Free Cash Flow 2018 28537000 2017 4462000 2016 16327000 Earnings per Share 2018 20.68 6.32 2016 Price/Earnings Ratio 2018 73.38 2017 190.16 2016 153.03 Return on Equity 2018 23.13% 2017 10.95% 2016 12.29% Net Profit Margin 2018 4.33% 2017 1.71% 2016 1.74% Total Current Assets/Total Current Liabilities Industry Average 75101000 68391000 60197000 57883000 45781000 43816000 Total Liabilities / Total Stockholder Equity 119099000 43549000 103601000 27709000 64117000 19285000 Operating Cash Flows - Capital Expenditure 30723000 2186000 18434000 13972000 16443000 116000 Net income / Weighted Average 10073000 487000 3033000 480000 2371000 474000 Market Price per Share / Earnings per Share 1,478.02 20.14 1,169.47 749.87 4.9 Net Income / Total Stockholder Equity 10073000 43549000 3033000 27709000 2371000 19285000 Net Income / Total Net Sales 10073000 232887000 3033000 177866000 2371000 135987000 Current Ratio Total Current Assets/Total Current Liabilities Industry Average 2018 0.8 51427000 64420000 2017 0.97 79146000 81389000 2016 0.76 38369000 50576000 Debt/Equity Ratio Total Liabilities/Total Stockholder Equity 2018 1.74 3.38E+08 193884000 2017 2.13 3.02E+08 142007000 2016 2.25 2.8E+08 124110000 Free Cash Flow Operating Cash Flows - Capital Expenditure 2018 293000 43602000 43309000 2017 38028000 39151000 1123000 2016 36385000 39344000 2959000 Earnings per Share Net income /Weighted Average 2018 2.94 19953000 6778000 2017 4.84 29847000 6164000 2016 2.16 13333000 6168000 Price/Earnings Ratio Market Price per Share / Earnings per Share 2018 10.01 28.54 2.85 2017 8.17 38.88 4.76 2016 20.25 42.53 Return on Equity Net Income / Total Stockholder Equity 2018 10.29% 19953000 193884000 2017 21.02% 29847000 142007000 2016 10.74% 13333000 124110000 Net Profit Margin Net Income / Total Net Sales 2018 11.68% 19953000 170756000 2017 18.59% 29847000 160546000 2016 8.14% 13333000 163786000 6.15 2.1


