

Answered step by step
Verified Expert Solution
Question
1 Approved Answer
NEED ANALYSIS PART 1 , 2 , 4 PLEAAAAASE INCLUDE MATLAB CODE ALL THE THINGS YOU NEED IS IN PICTURE INCLUDING DATA , 1 .
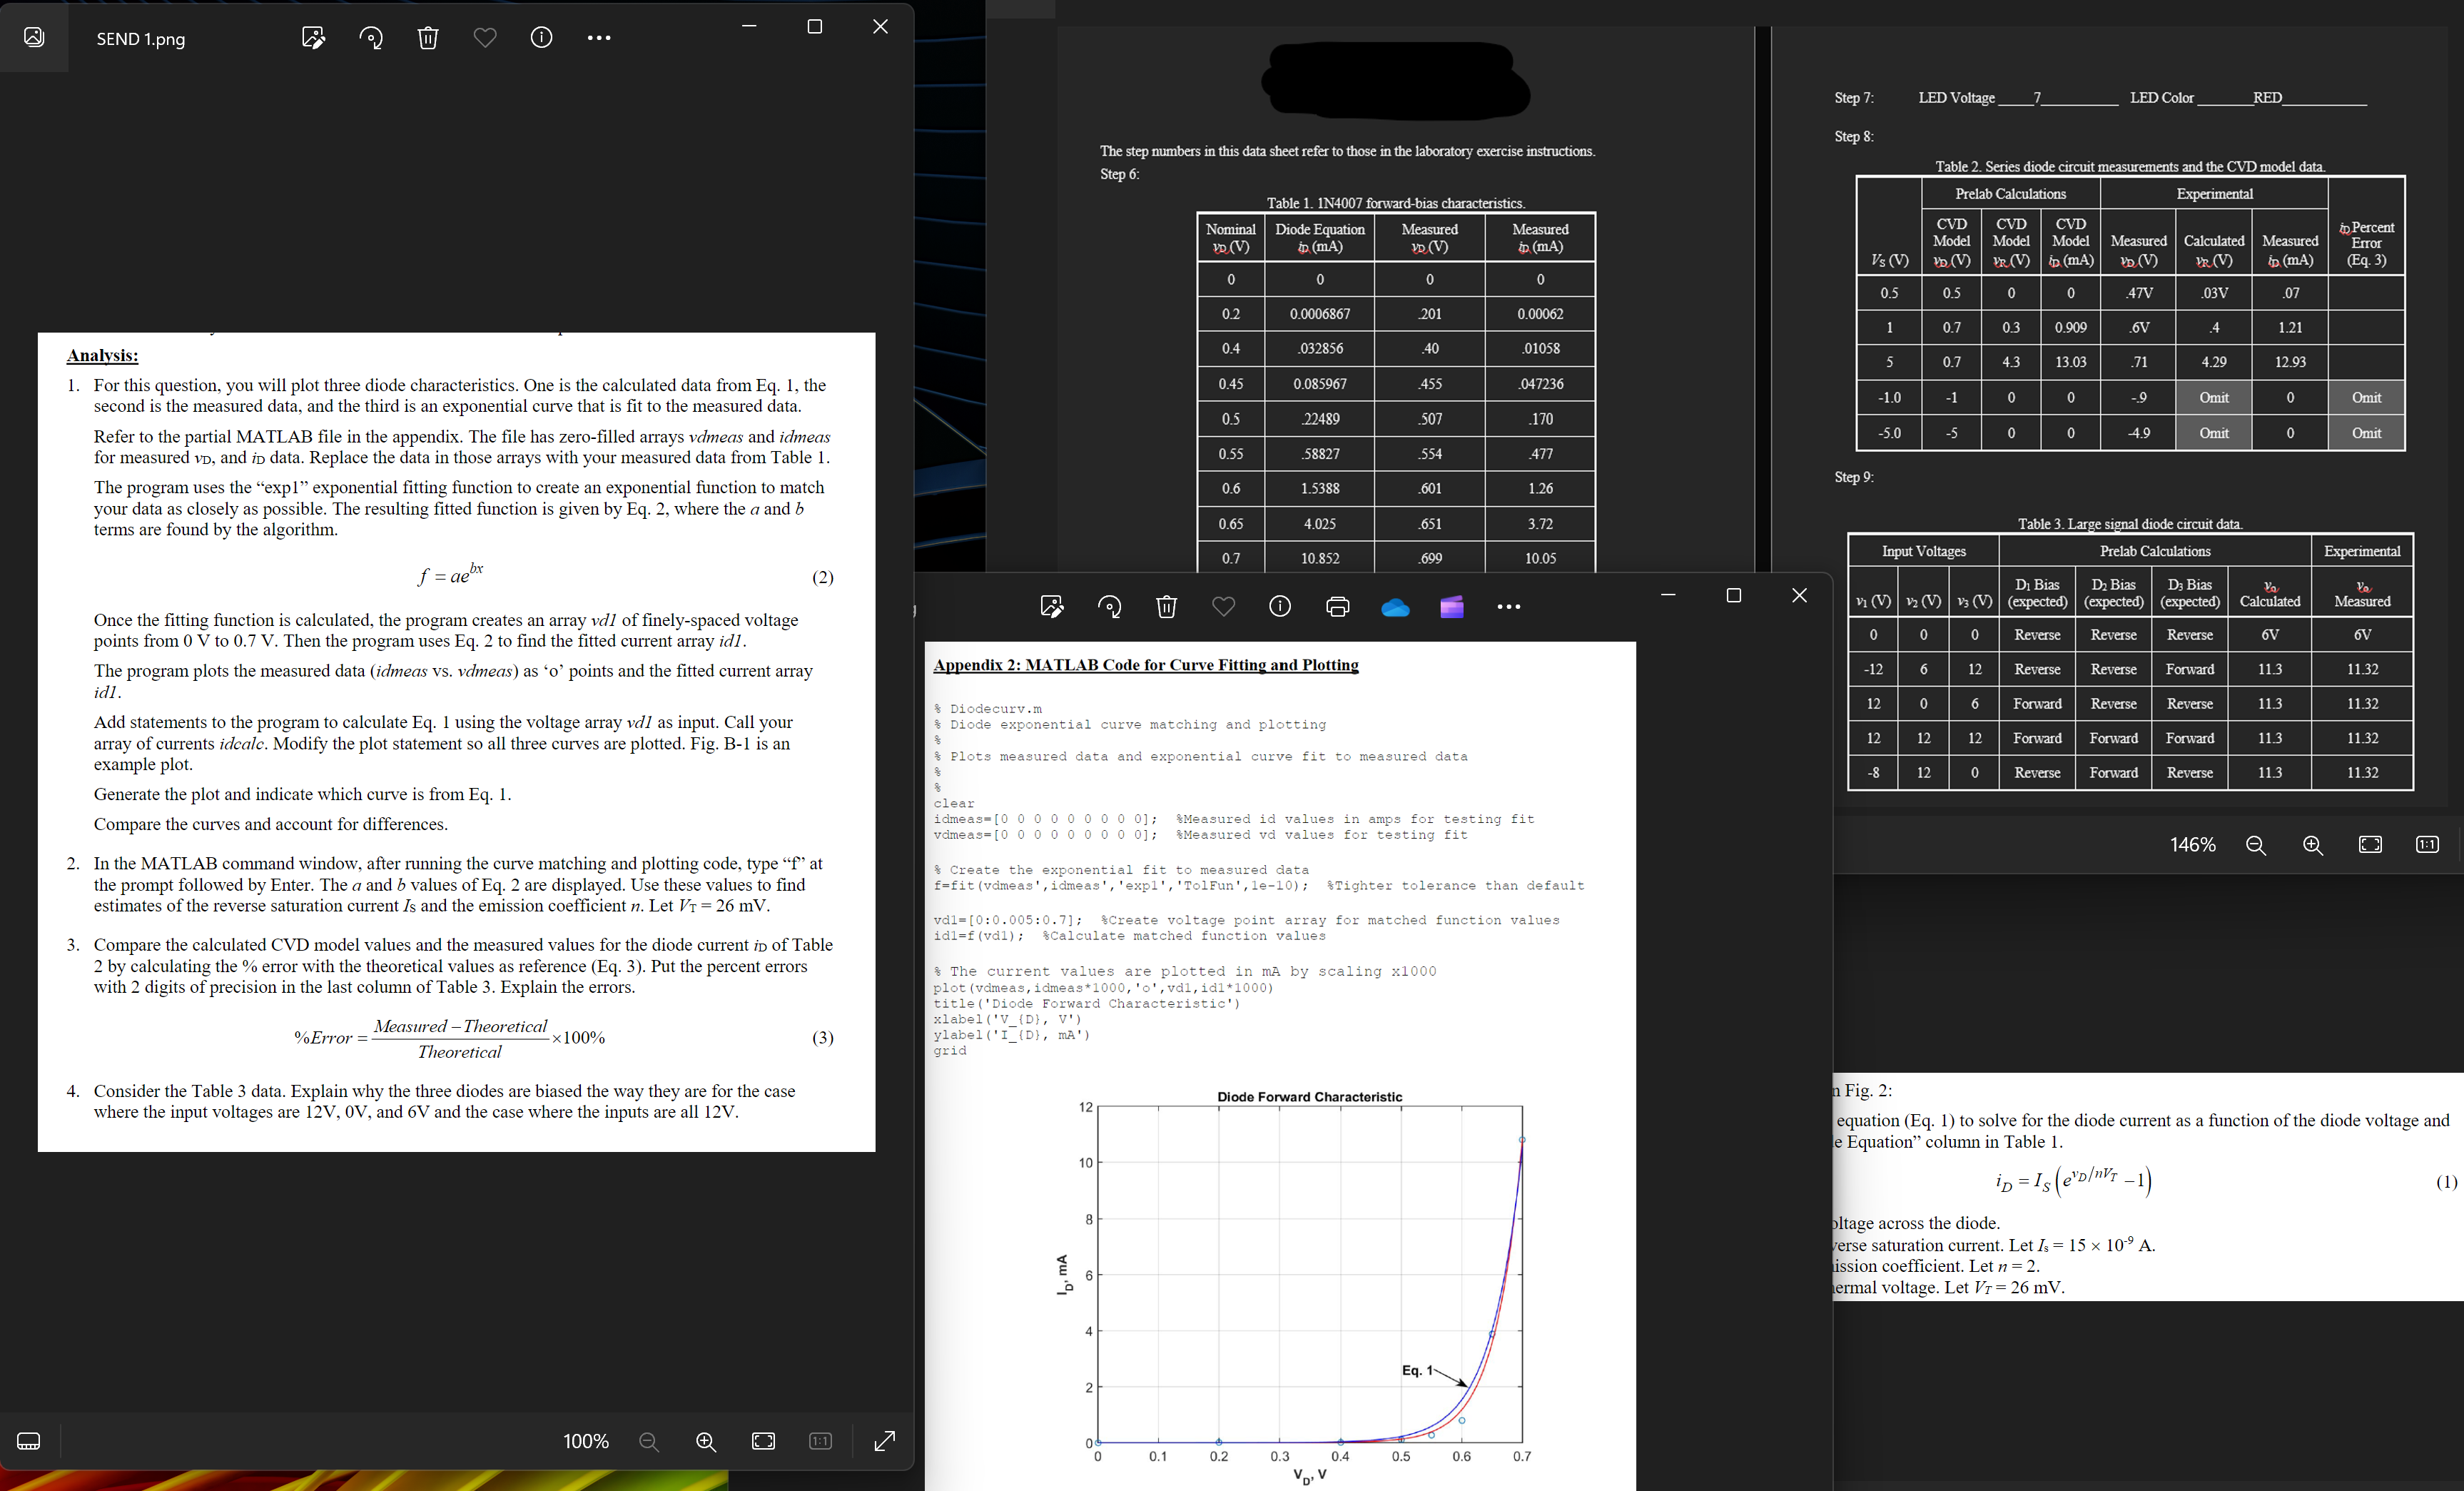
NEED ANALYSIS PART PLEAAAAASE INCLUDE MATLAB CODE ALL THE THINGS YOU NEED IS IN PICTURE INCLUDING DATA For this question, you will plot three diode characteristics. One is the calculated data from Eq the second is the measured data, and the third is an exponential curve that is fit to the measured data.
Refer to the partial MATLAB file in the appendix. The file has zerofilled arrays vdmeas and idmeas
for measured vD and iD data. Replace the data in those arrays with your measured data from Table
The program uses the exp exponential fitting function to create an exponential function to match
your data as closely as possible. The resulting fitted function is given by Eq where the a and b
terms are found by the algorithm. Once the fitting function is calculated, the program creates an array vd of finelyspaced voltage points from V to V Then the program uses Eq to find the fitted current array id
The program plots the measured data idmeas vs vdmeas as o points and the fitted current array
id Add statements to the program to calculate Eq using the voltage array vd as input. Call your
array of currents idcalc. Modify the plot statement so all three curves are plotted. Fig. B is an
example plot.
Generate the plot and indicate which curve is from Eq
Compare the curves and account for differences.
In the MATLAB command window, after running the curve matching and plotting code, type f at
the prompt followed by Enter. The a and b values of Eq are displayed. Use these values to find
estimates of the reverse saturation current IS and the emission coefficient n Let VT mV
Consider the Table data. Explain why the three diodes are biased the way they are for the case
where the input voltages are VV and V and the case where the inputs are all V WILL RATE ALL THUMBS QUICK
Step by Step Solution
There are 3 Steps involved in it
Step: 1

Get Instant Access to Expert-Tailored Solutions
See step-by-step solutions with expert insights and AI powered tools for academic success
Step: 2

Step: 3
Ace Your Homework with AI
Get the answers you need in no time with our AI-driven, step-by-step assistance
Get Started
Database And Expert Systems Applications 19th International Conference Dexa 2008 Turin Italy September 2008 Proceedings Lncs 5181
Authors: Sourav S. Bhowmick ,Josef Kung ,Roland Wagner
2008th Edition
3540856536, 978-3540856535