need ans asap
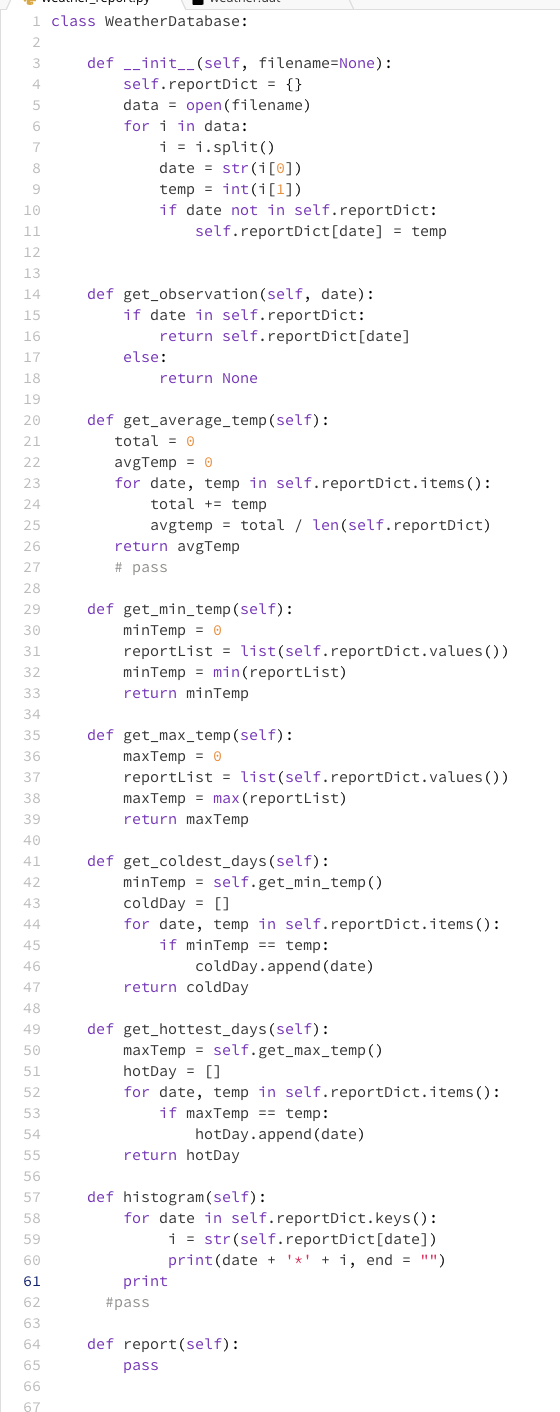
Hi, my code for the average temp isn't working. I think there's something wrong with my code for reading the file (like its not reading the date properly) cause min/max, and cold/hot day code works but average and histogram isn't working.
Question

 My code:

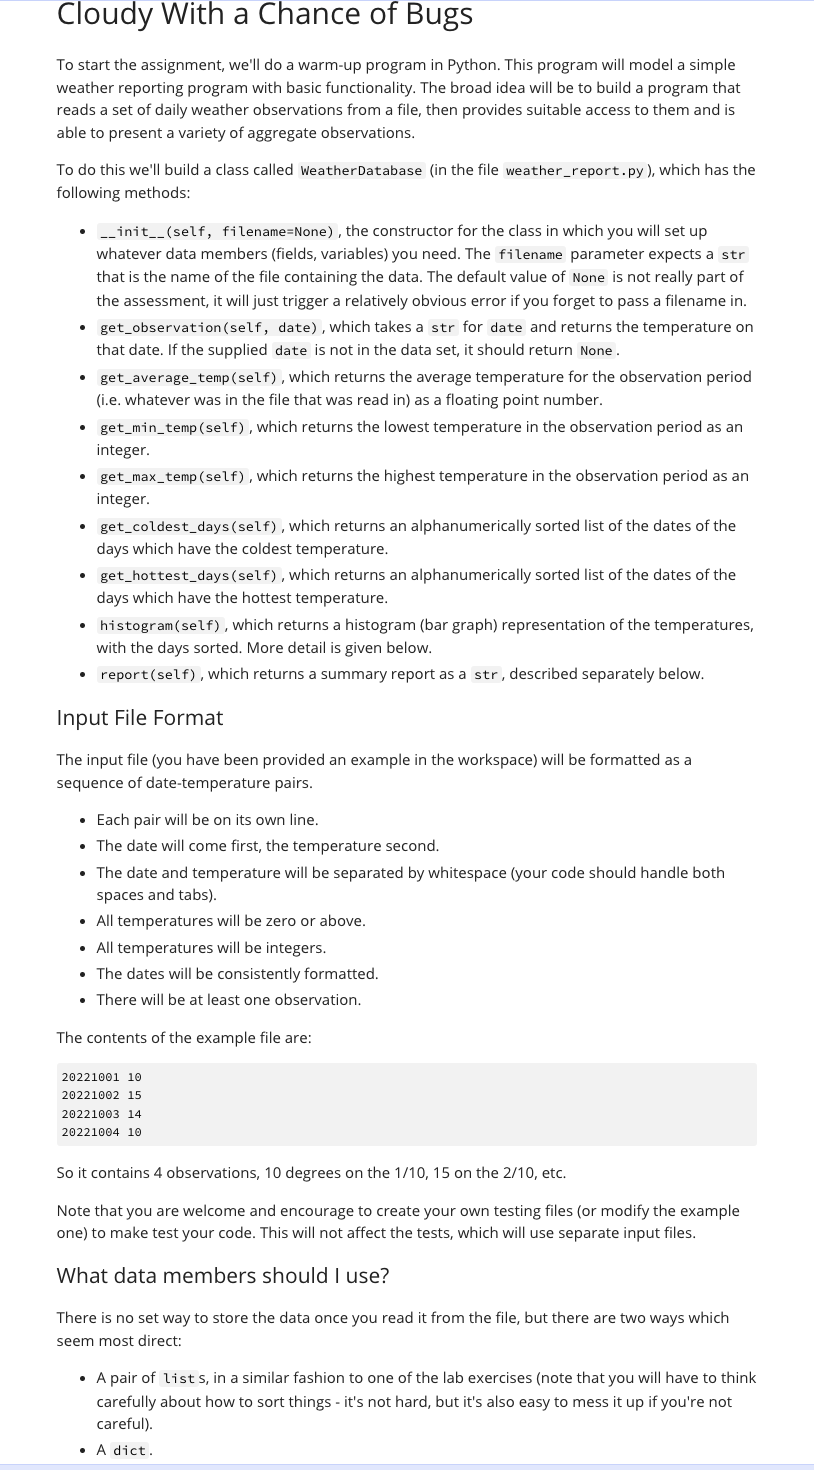
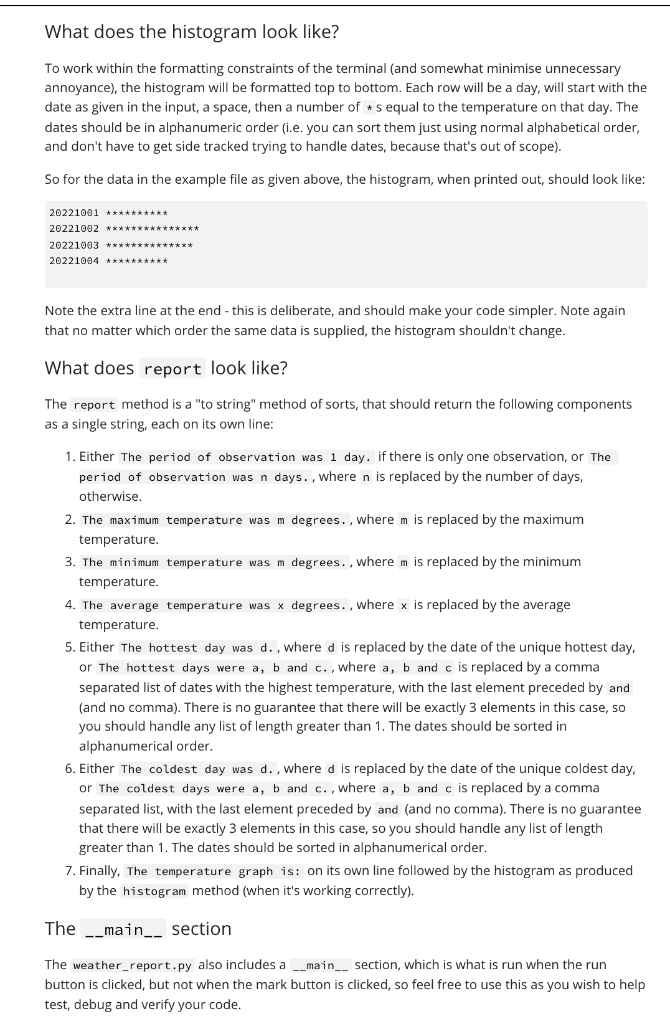
Cloudy With a Chance of Bugs To start the assignment, we'll do a warm-up program in Python. This program will model a simple weather reporting program with basic functionality. The broad idea will be to build a program that reads a set of daily weather observations from a file, then provides suitable access to them and is able to present a variety of aggregate observations. To do this we'll build a class called WeatherDatabase (in the file weather_report.py), which has the following methods: -__init__ (self, filename=None), the constructor for the class in which you will set up whatever data members (fields, variables) you need. The filename parameter expects a str that is the name of the file containing the data. The default value of None is not really part of the assessment, it will just trigger a relatively obvious error if you forget to pass a filename in. - get_observation(self, date), which takes a str for date and returns the temperature on that date. If the supplied date is not in the data set, it should return None. - get_average_temp(self), which returns the average temperature for the observation period (i.e. whatever was in the file that was read in) as a floating point number. - get_min_temp(self), which returns the lowest temperature in the observation period as an integer. - get_max_temp(self), which returns the highest temperature in the observation period as an integer. - get_coldest_days(self), which returns an alphanumerically sorted list of the dates of the days which have the coldest temperature. - get_hottest_days(self), which returns an alphanumerically sorted list of the dates of the days which have the hottest temperature. - histogram(self), which returns a histogram (bar graph) representation of the temperatures, with the days sorted. More detail is given below. - report(self), which returns a summary report as a str, described separately below. Input File Format The input file (you have been provided an example in the workspace) will be formatted as a sequence of date-temperature pairs. - Each pair will be on its own line. - The date will come first, the temperature second. - The date and temperature will be separated by whitespace (your code should handle both spaces and tabs). - All temperatures will be zero or above. - All temperatures will be integers. - The dates will be consistently formatted. - There will be at least one observation. The contents of the example file are: 2022100120221002202210032022100410151410 So it contains 4 observations, 10 degrees on the 1/10,15 on the 2/10, etc. Note that you are welcome and encourage to create your own testing files (or modify the example one) to make test your code. This will not affect the tests, which will use separate input files. What data members should I use? There is no set way to store the data once you read it from the file, but there are two ways which seem most direct: - A pair of list s, in a similar fashion to one of the lab exercises (note that you will have to think carefully about how to sort things - it's not hard, but it's also easy to mess it up if you're not careful). - A dict. What does the histogram look like? To work within the formatting constraints of the terminal (and somewhat minimise unnecessary annoyance), the histogram will be formatted top to bottom. Each row will be a day, will start with the date as given in the input, a space, then a number of * s equal to the temperature on that day. The dates should be in alphanumeric order (i.e. you can sort them just using normal alphabetical order, and don't have to get side tracked trying to handle dates, because that's out of scope). So for the data in the example file as given above, the histogram, when printed out, should look like: 20221001202210022022100320221004 Note the extra line at the end - this is deliberate, and should make your code simpler. Note again that no matter which order the same data is supplied, the histogram shouldn't change. What does report look like? The report method is a "to string" method of sorts, that should return the following components as a single string, each on its own line: 1. Either The period of observation was 1 day. if there is only one observation, or The period of observation was n days. , where n is replaced by the number of days, otherwise. 2. The maximum temperature was m degrees., where m is replaced by the maximum temperature. 3. The minimum temperature was m degrees., where m is replaced by the minimum temperature. 4. The average temperature was x degrees., where x is replaced by the average temperature. 5. Either The hottest day was d. , where d is replaced by the date of the unique hottest day, or The hottest days were a,b and c. , where a,b and c is replaced by a comma separated list of dates with the highest temperature, with the last element preceded by and (and no comma). There is no guarantee that there will be exactly 3 elements in this case, so you should handle any list of length greater than 1 . The dates should be sorted in alphanumerical order. 6. Either The coldest day was d. , where d is replaced by the date of the unique coldest day, or The coldest days were a,b and c.. where a,b and c is replaced by a comma separated list, with the last element preceded by and (and no comma). There is no guarantee that there will be exactly 3 elements in this case, so you should handle any list of length greater than 1. The dates should be sorted in alphanumerical order. 7. Finally, The temperature graph is: on its own line followed by the histogram as produced by the histogram method (when it's working correctly). The section The weather_report.py also includes a section, which is what is run when the run button is clicked, but not when the mark button is clicked, so feel free to use this as you wish to help test, debug and verify your code

 My code:


