need answers of all questions (urgent)
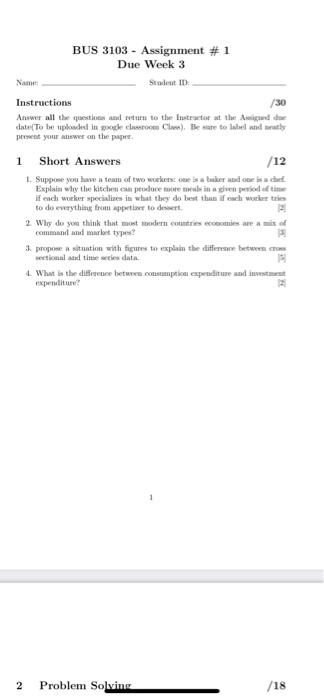
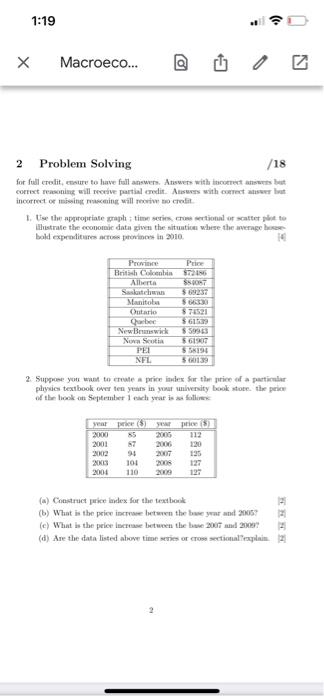
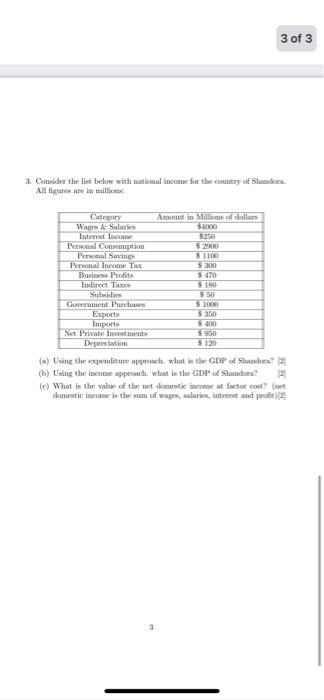
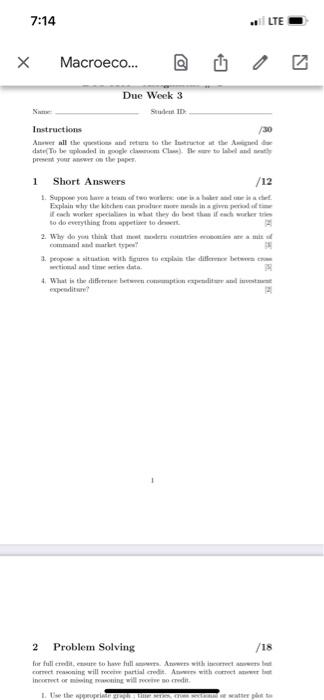
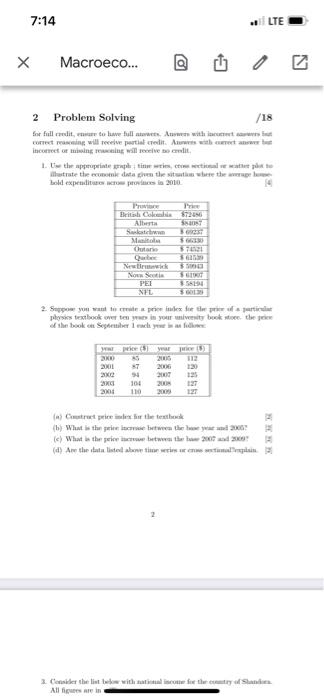
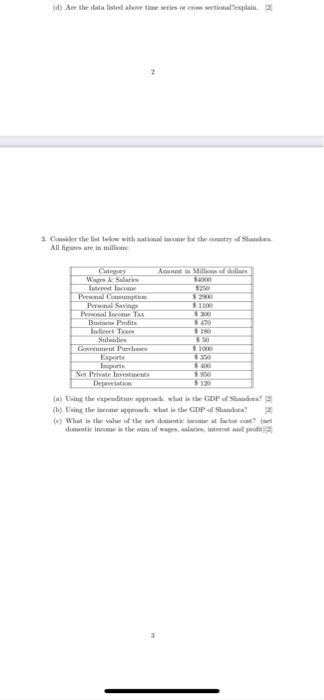
BUS 3103 Assignment # 11 Due Week 3 Name Student ID: Instructions /30 Answer all the questions and return to the Instructor at the Assigned de date(To be uploaded in google classroom Class). Be sure to label and neatly present your answer on the paper. 1 Short Answers /12 1. Suppose you have a team of two workers: one is a baker and one is a chef Explain why the kitchen can produce more meals in a given period of time if each worker specializes in what they do best than if each worker tries to do everything from appetizer to dessert. 2. Why do you think that most modern countries economies are a mix of command and market types? 3. propose a situation with figures to explain the difference between cross sectional and time series data. P 4. What is the difference between consumption expenditure and investment expenditure? 2 Problem Solving /18 1:19 X Macroeco... 2 Problem Solving /18 for full credit, ensure to have full answers. Answers with incorrect answers but correct reasoning will receive partial credit. Answers with correct answer but incorrect or missing reasoning will receive no credit. 1. Use the appropriate graph: time series, cross sectional or scatter plot to illustrate the economic data given the situation where the average hose bold expenditures across provinces in 2010 14 Province British Colombia Price $72486 Alberta Saskatchwan $69237 Manitoba $ 66330 Outario $74521 Quebec $61539 New Brunswick $59943 Nova Scotia $61907 $58194 PEI NFL $ 60139 2. Suppose you want to create a price index for the price of a particular physics textbook over ten years in your university book store, the price of the book on September 1 each year is as follow year price ($) year price (5) 2000 85 2005 112 2001 87 2006 120 2002 94 2007 125 127 2003 101 2008 2004 2009 127 (a) Construct price index for the textbook (b) What is the price increase between the base year and 2005? (e) What is the price increase between the base 2007 and 2009? (d) Are the data listed above time series or cross sectional explain 2 a A 3 of 3 3. Consider the list below with national income for the country of Shandora All figures are in millione Category Amount in Millions of dollars Wages & Salaries $4000 Interest Income $250 Personal Consumption $2000 Personal Savings $1100 Personal Income Tax $300 Business Profits $470 $180 Indirect Taxes Subsidies $50 Government Purchases $1000 Exports $350 $400 Imports $900 Net Private Investments Depreciation $120 (a) Using the expenditure approach, what is the GDP of Shandora? (b) Using the income approach, what is the GDP of Shandora? (e) What is the value of the net domestic income at factor cost? (net domestic income is the sum of wages, salaries, interest and prod 3 7:14 X Macroeco... Due Week 3 Name Stud ID Instructions /30 Answer all the questions and return to the Instructor at the Aged de date(To be uploaded in google clawom Clas). Be sure to label and atly present your answer on the paper. 1 Short Answers /12 1. Suppose you have a team of two workers one is a baker and one is a chef Explain why the kitchen can produce more meals in a given period of time if each worker specialises in what they do bot than if each worker tries to do everything from appetizer to dessert A 2. Why do you think that most moders notries economies are a mix of 3. propose a situation with figures to explain the differ between co etical and time series data. 38 4. What is the difference between comption expenditure and investment expenditure? 2 Problem Solving /18 for full credit, ensure to have full amours. Aowers with incorrect ans correct reasoning will receive partial credit. Ars with correct bot incorrect or ming woning will receive no credit. 1. Use the appropriate graph; tine series, ces seca e scatter pl LTE 7:14 X LTE Macroeco... 2 Problem Solving /18 t for full credit, ensure to have full awwers. Answers with incorrect correct reasoning will receive partial credit. Answers with correct answer but incorrect or missing reasoning will receive no credit, 1. Use the appropriate graph time series, cross sectional ve weather plot to illustrate the economic data given the situation where the average le bold expenditures across provinces in 2010 British Colombia $72456 Alberta $84057 Saskatchww Manitoba $66330 Outario $74121 Queber 362539 New Brunswick $50043 $GEOT Nova Scotia PEI $58194 NFL $ 00139 2. Suppose you want to create a price index for the price of a particular physics textbook over ten years in your university book store the price of the book on September 1 each year is as follo your price (5) year price (5) 2105 112 87 2006 120 2001 200 94 2003 104 2008 127 2001 110 2009 127 (a) Construct price index for the textbook (b) What is the price ince between the hose year and 2006 (e) What is the price ince between the 2007 and 2000 (d) Are the data listed above time series or cross sectional explain 3. Consider the list below with national income for the country of Standors All figures are in KERE (d) Are the data listed above time series or css sectional explain 1 Consider the list below with national income for the country of Sanders All figures are in million Category Ant in Millems of dollars Wages & Salaris $4000 Interest Income $250 Personal Consumption $200 Personal Savings $1100 Personal Income Tax 1300 Buxo Profis 470 Ilirect Tam $ 180 150 Subsidies Gonment Purchase $1000 $350 Exporta Imports $400 Net Private Investments Depreciation (a) Using the expenditure approach what is the GDP of Shado (b) Using the income approach, what is the GDP of Shando? (e) What is the value of the set domustic income at auctor co? ( domestic income is the sum of wages, salaries, interest and peo BUS 3103 Assignment # 11 Due Week 3 Name Student ID: Instructions /30 Answer all the questions and return to the Instructor at the Assigned de date(To be uploaded in google classroom Class). Be sure to label and neatly present your answer on the paper. 1 Short Answers /12 1. Suppose you have a team of two workers: one is a baker and one is a chef Explain why the kitchen can produce more meals in a given period of time if each worker specializes in what they do best than if each worker tries to do everything from appetizer to dessert. 2. Why do you think that most modern countries economies are a mix of command and market types? 3. propose a situation with figures to explain the difference between cross sectional and time series data. P 4. What is the difference between consumption expenditure and investment expenditure? 2 Problem Solving /18 1:19 X Macroeco... 2 Problem Solving /18 for full credit, ensure to have full answers. Answers with incorrect answers but correct reasoning will receive partial credit. Answers with correct answer but incorrect or missing reasoning will receive no credit. 1. Use the appropriate graph: time series, cross sectional or scatter plot to illustrate the economic data given the situation where the average hose bold expenditures across provinces in 2010 14 Province British Colombia Price $72486 Alberta Saskatchwan $69237 Manitoba $ 66330 Outario $74521 Quebec $61539 New Brunswick $59943 Nova Scotia $61907 $58194 PEI NFL $ 60139 2. Suppose you want to create a price index for the price of a particular physics textbook over ten years in your university book store, the price of the book on September 1 each year is as follow year price ($) year price (5) 2000 85 2005 112 2001 87 2006 120 2002 94 2007 125 127 2003 101 2008 2004 2009 127 (a) Construct price index for the textbook (b) What is the price increase between the base year and 2005? (e) What is the price increase between the base 2007 and 2009? (d) Are the data listed above time series or cross sectional explain 2 a A 3 of 3 3. Consider the list below with national income for the country of Shandora All figures are in millione Category Amount in Millions of dollars Wages & Salaries $4000 Interest Income $250 Personal Consumption $2000 Personal Savings $1100 Personal Income Tax $300 Business Profits $470 $180 Indirect Taxes Subsidies $50 Government Purchases $1000 Exports $350 $400 Imports $900 Net Private Investments Depreciation $120 (a) Using the expenditure approach, what is the GDP of Shandora? (b) Using the income approach, what is the GDP of Shandora? (e) What is the value of the net domestic income at factor cost? (net domestic income is the sum of wages, salaries, interest and prod 3 7:14 X Macroeco... Due Week 3 Name Stud ID Instructions /30 Answer all the questions and return to the Instructor at the Aged de date(To be uploaded in google clawom Clas). Be sure to label and atly present your answer on the paper. 1 Short Answers /12 1. Suppose you have a team of two workers one is a baker and one is a chef Explain why the kitchen can produce more meals in a given period of time if each worker specialises in what they do bot than if each worker tries to do everything from appetizer to dessert A 2. Why do you think that most moders notries economies are a mix of 3. propose a situation with figures to explain the differ between co etical and time series data. 38 4. What is the difference between comption expenditure and investment expenditure? 2 Problem Solving /18 for full credit, ensure to have full amours. Aowers with incorrect ans correct reasoning will receive partial credit. Ars with correct bot incorrect or ming woning will receive no credit. 1. Use the appropriate graph; tine series, ces seca e scatter pl LTE 7:14 X LTE Macroeco... 2 Problem Solving /18 t for full credit, ensure to have full awwers. Answers with incorrect correct reasoning will receive partial credit. Answers with correct answer but incorrect or missing reasoning will receive no credit, 1. Use the appropriate graph time series, cross sectional ve weather plot to illustrate the economic data given the situation where the average le bold expenditures across provinces in 2010 British Colombia $72456 Alberta $84057 Saskatchww Manitoba $66330 Outario $74121 Queber 362539 New Brunswick $50043 $GEOT Nova Scotia PEI $58194 NFL $ 00139 2. Suppose you want to create a price index for the price of a particular physics textbook over ten years in your university book store the price of the book on September 1 each year is as follo your price (5) year price (5) 2105 112 87 2006 120 2001 200 94 2003 104 2008 127 2001 110 2009 127 (a) Construct price index for the textbook (b) What is the price ince between the hose year and 2006 (e) What is the price ince between the 2007 and 2000 (d) Are the data listed above time series or cross sectional explain 3. Consider the list below with national income for the country of Standors All figures are in KERE (d) Are the data listed above time series or css sectional explain 1 Consider the list below with national income for the country of Sanders All figures are in million Category Ant in Millems of dollars Wages & Salaris $4000 Interest Income $250 Personal Consumption $200 Personal Savings $1100 Personal Income Tax 1300 Buxo Profis 470 Ilirect Tam $ 180 150 Subsidies Gonment Purchase $1000 $350 Exporta Imports $400 Net Private Investments Depreciation (a) Using the expenditure approach what is the GDP of Shado (b) Using the income approach, what is the GDP of Shando? (e) What is the value of the set domustic income at auctor co? ( domestic income is the sum of wages, salaries, interest and peo