Answered step by step
Verified Expert Solution
Question
1 Approved Answer
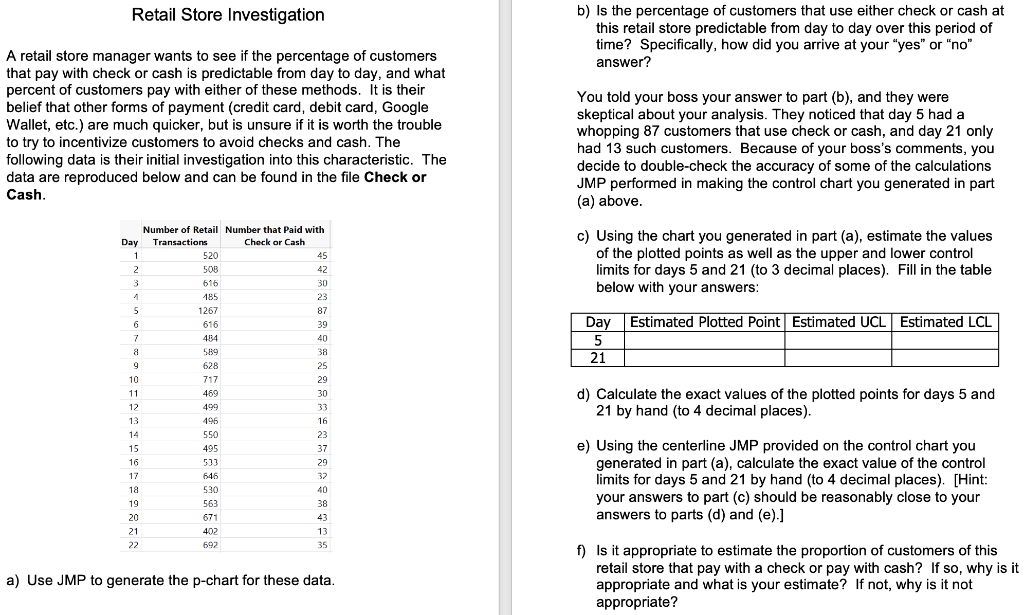
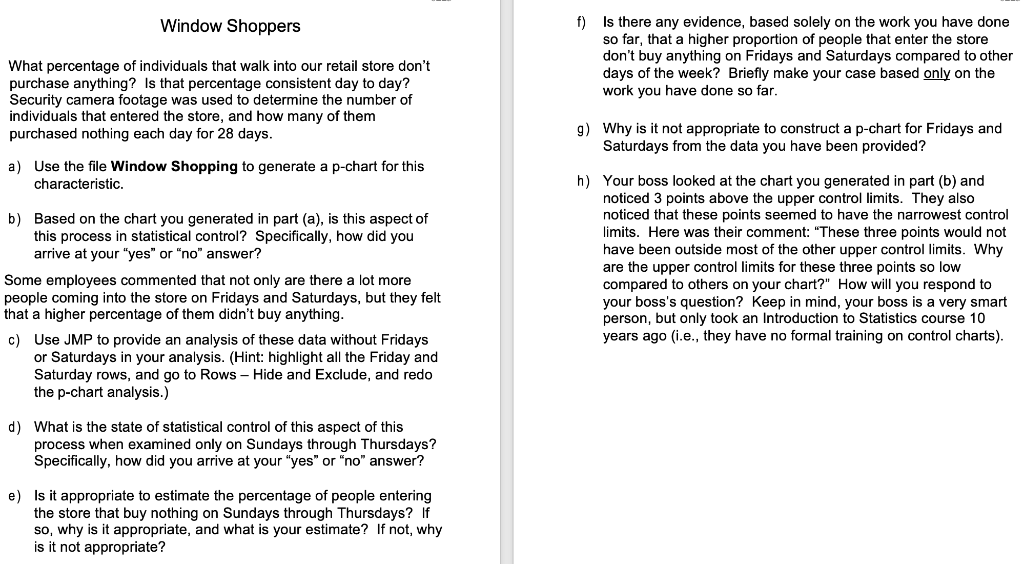
Need answers of Q.1- a), b) and Q.2- a), b), c), d), e), f), g), h). Retail Store Investigation b) Is the percentage of customers


Need answers of Q.1- a), b) and
Q.2- a), b), c), d), e), f), g), h).
Retail Store Investigation b) Is the percentage of customers that use either check or cash at this retail store predictable from day to day over this period of time? Specifically, how did you arrive at your "yes" or "no" A retail store manager wants to see if the percentage of customers answer? that pay with check or cash is predictable from day to day, and what percent of customers pay with either of these methods. It is their belief that other forms of payment (credit card, debit card, Google Wallet, etc.) are much quicker, but is unsure if it is worth the trouble to try to incentivize customers to avoid checks and cash. The following data is their initial investigation into this characteristic. The data are reproduced below and can be found in the file Check or Cash. You told your boss your answer to part (b), and they were skeptical about your analysis. They noticed that day 5 had a whopping 87 customers that use check or cash, and day 21 only had 13 such customers. Because of your boss's comments, you decide to double-check the accuracy of some of the calculations JMP performed in making the control chart you generated in part (a) above. c) Using the chart you generated in part (a), estimate the values of the plotted points as well as the upper and lower control limits for days 5 and 21 (to 3 decimal places). Fill in the table below with your answers: d) Calculate the exact values of the plotted points for days 5 and 21 by hand (to 4 decimal places). e) Using the centerline JMP provided on the control chart you generated in part (a), calculate the exact value of the control limits for days 5 and 21 by hand (to 4 decimal places). [Hint: your answers to part (c) should be reasonably close to your answers to parts (d) and (e).] f) Is it appropriate to estimate the proportion of customers of this retail store that pay with a check or pay with cash? If so, why is it a) Use JMP to generate the p-chart for these data. appropriate and what is your estimate? If not, why is it not appropriate? Window Shoppers f) Is there any evidence, based solely on the work you have done so far, that a higher proportion of people that enter the store What percentage of individuals that walk into our retail store don't don't buy anything on Fridays and Saturdays compared to other purchase anything? Is that percentage consistent day to day? days of the week? Briefly make your case based only on the Security camera footage was used to determine the number of individuals that entered the store, and how many of them purchased nothing each day for 28 days. g) Why is it not appropriate to construct a p-chart for Fridays and a) Use the file Window Shopping to generate a p-chart for this Saturdays from the data you have been provided? characteristic. h) Your boss looked at the chart you generated in part (b) and noticed 3 points above the upper control limits. They also b) Based on the chart you generated in part (a), is this aspect of noticed that these points seemed to have the narrowest control this process in statistical control? Specifically, how did you limits. Here was their comment: "These three points would not arrive at your "yes" or "no" answer? have been outside most of the other upper control limits. Why Some employees commented that not only are there a lot more are the upper control limits for these three points so low people coming into the store on Fridays and Saturdays, but they felt that a higher percentage of them didn't buy anything. compared to others on your chart?" How will you respond to your boss's question? Keep in mind, your boss is a very smart person, but only took an Introduction to Statistics course 10 c) Use JMP to provide an analysis of these data without Fridays years ago (i.e., they have no formal training on control charts). or Saturdays in your analysis. (Hint: highlight all the Friday and Saturday rows, and go to Rows - Hide and Exclude, and redo the p-chart analysis.) d) What is the state of statistical control of this aspect of this process when examined only on Sundays through Thursdays? Specifically, how did you arrive at your "yes" or "no" answer? e) Is it appropriate to estimate the percentage of people entering the store that buy nothing on Sundays through Thursdays? If so, why is it appropriate, and what is your estimate? If not, why is it not appropriate? Retail Store Investigation b) Is the percentage of customers that use either check or cash at this retail store predictable from day to day over this period of time? Specifically, how did you arrive at your "yes" or "no" A retail store manager wants to see if the percentage of customers answer? that pay with check or cash is predictable from day to day, and what percent of customers pay with either of these methods. It is their belief that other forms of payment (credit card, debit card, Google Wallet, etc.) are much quicker, but is unsure if it is worth the trouble to try to incentivize customers to avoid checks and cash. The following data is their initial investigation into this characteristic. The data are reproduced below and can be found in the file Check or Cash. You told your boss your answer to part (b), and they were skeptical about your analysis. They noticed that day 5 had a whopping 87 customers that use check or cash, and day 21 only had 13 such customers. Because of your boss's comments, you decide to double-check the accuracy of some of the calculations JMP performed in making the control chart you generated in part (a) above. c) Using the chart you generated in part (a), estimate the values of the plotted points as well as the upper and lower control limits for days 5 and 21 (to 3 decimal places). Fill in the table below with your answers: d) Calculate the exact values of the plotted points for days 5 and 21 by hand (to 4 decimal places). e) Using the centerline JMP provided on the control chart you generated in part (a), calculate the exact value of the control limits for days 5 and 21 by hand (to 4 decimal places). [Hint: your answers to part (c) should be reasonably close to your answers to parts (d) and (e).] f) Is it appropriate to estimate the proportion of customers of this retail store that pay with a check or pay with cash? If so, why is it a) Use JMP to generate the p-chart for these data. appropriate and what is your estimate? If not, why is it not appropriate? Window Shoppers f) Is there any evidence, based solely on the work you have done so far, that a higher proportion of people that enter the store What percentage of individuals that walk into our retail store don't don't buy anything on Fridays and Saturdays compared to other purchase anything? Is that percentage consistent day to day? days of the week? Briefly make your case based only on the Security camera footage was used to determine the number of individuals that entered the store, and how many of them purchased nothing each day for 28 days. g) Why is it not appropriate to construct a p-chart for Fridays and a) Use the file Window Shopping to generate a p-chart for this Saturdays from the data you have been provided? characteristic. h) Your boss looked at the chart you generated in part (b) and noticed 3 points above the upper control limits. They also b) Based on the chart you generated in part (a), is this aspect of noticed that these points seemed to have the narrowest control this process in statistical control? Specifically, how did you limits. Here was their comment: "These three points would not arrive at your "yes" or "no" answer? have been outside most of the other upper control limits. Why Some employees commented that not only are there a lot more are the upper control limits for these three points so low people coming into the store on Fridays and Saturdays, but they felt that a higher percentage of them didn't buy anything. compared to others on your chart?" How will you respond to your boss's question? Keep in mind, your boss is a very smart person, but only took an Introduction to Statistics course 10 c) Use JMP to provide an analysis of these data without Fridays years ago (i.e., they have no formal training on control charts). or Saturdays in your analysis. (Hint: highlight all the Friday and Saturday rows, and go to Rows - Hide and Exclude, and redo the p-chart analysis.) d) What is the state of statistical control of this aspect of this process when examined only on Sundays through Thursdays? Specifically, how did you arrive at your "yes" or "no" answer? e) Is it appropriate to estimate the percentage of people entering the store that buy nothing on Sundays through Thursdays? If so, why is it appropriate, and what is your estimate? If not, why is it not appropriateStep by Step Solution
There are 3 Steps involved in it
Step: 1

Get Instant Access to Expert-Tailored Solutions
See step-by-step solutions with expert insights and AI powered tools for academic success
Step: 2

Step: 3

Ace Your Homework with AI
Get the answers you need in no time with our AI-driven, step-by-step assistance
Get Started


