

Answered step by step
Verified Expert Solution
Question
1 Approved Answer
Need Excel Calculations please Q 14. Use ExtendSim to simulate the data entry process for audit claims presented in Figure 8.23. Release the work every
Need Excel Calculations please
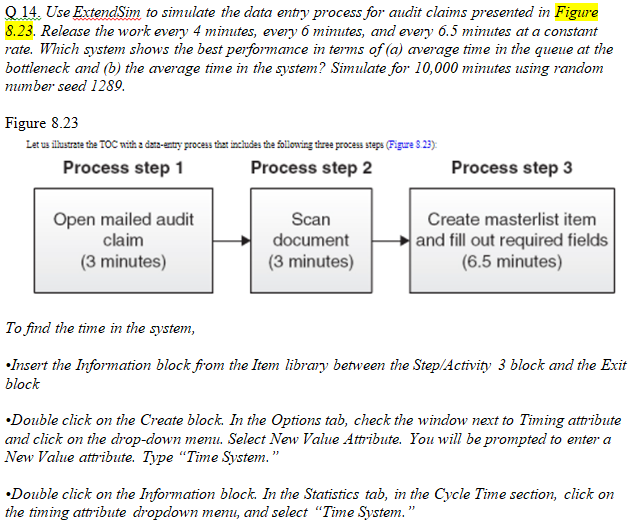
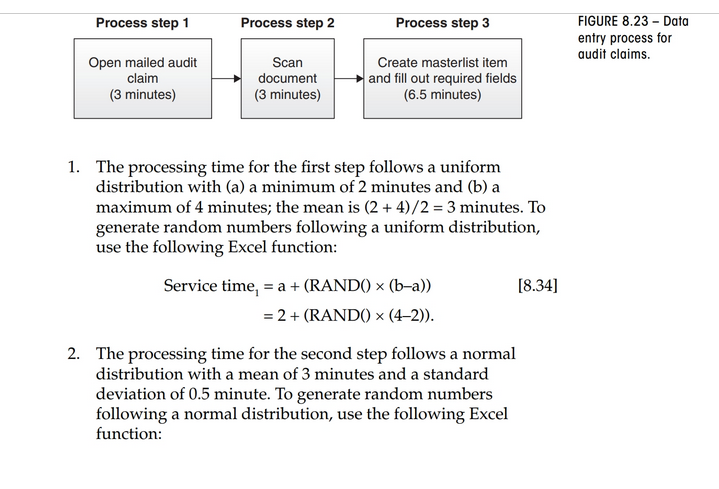
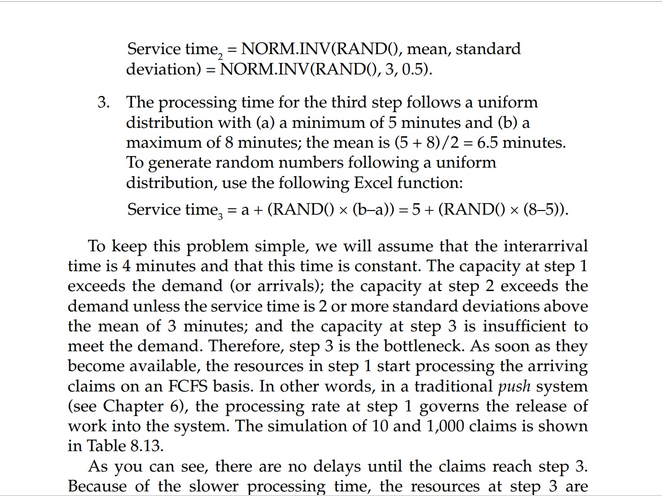
Q 14. Use ExtendSim to simulate the data entry process for audit claims presented in Figure 8.23. Release the work every 4 mimutes, every 6 minutes, and every 6.5 minutes at a constant rate. Which system shows the best performance in terms of (a) average time in the queue at the bottleneck and (b) the average time in the system? Simulate for 10,000 minutes using random number seed 1289 Figure 8.23 Let us ilustrate the TOC win a data-entry process that incledes the Solloning three process steps (Figure 3.23 ). To find the time in the system, -Insert the Information block fiom the Item library between the Step/Activity 3 block and the Exit block - Double click on the Create block. In the Options tab, check the window next to Timing attibute and click on the drop-down menu. Select New Value Attibute. You will be prompted to enter a New Value attibute. Type "Time System." -Double click on the Information block. In the Statistics tab, in the Cycle Time section, click on the timing attibute dropdown menu, and select "Time System." FIGURE 8.23 - Data entry process for audit claims. 1. The processing time for the first step follows a uniform distribution with (a) a minimum of 2 minutes and (b) a maximum of 4 minutes; the mean is (2+4)/2=3 minutes. To generate random numbers following a uniform distribution, use the following Excel function: Servicetime1=a+(RAND()(ba))=2+(RAND()(42)) 2. The processing time for the second step follows a normal distribution with a mean of 3 minutes and a standard deviation of 0.5 minute. To generate random numbers following a normal distribution, use the following Excel function: Service time 2= NORM.INV(RAND(), mean, standard deviation )= NORM.INV(RAND (),3,0.5). 3. The processing time for the third step follows a uniform distribution with (a) a minimum of 5 minutes and (b) a maximum of 8 minutes; the mean is (5+8)/2=6.5 minutes. To generate random numbers following a uniform distribution, use the following Excel function: Service time tim 3=a+(RAND()(ba))=5+(RAND()(85)). To keep this problem simple, we will assume that the interarrival time is 4 minutes and that this time is constant. The capacity at step 1 exceeds the demand (or arrivals); the capacity at step 2 exceeds the demand unless the service time is 2 or more standard deviations above the mean of 3 minutes; and the capacity at step 3 is insufficient to meet the demand. Therefore, step 3 is the bottleneck. As soon as they become available, the resources in step 1 start processing the arriving claims on an FCFS basis. In other words, in a traditional push system (see Chapter 6), the processing rate at step 1 governs the release of work into the system. The simulation of 10 and 1,000 claims is shown in Table 8.13. As you can see, there are no delays until the claims reach step 3. Q 14. Use ExtendSim to simulate the data entry process for audit claims presented in Figure 8.23. Release the work every 4 mimutes, every 6 minutes, and every 6.5 minutes at a constant rate. Which system shows the best performance in terms of (a) average time in the queue at the bottleneck and (b) the average time in the system? Simulate for 10,000 minutes using random number seed 1289 Figure 8.23 Let us ilustrate the TOC win a data-entry process that incledes the Solloning three process steps (Figure 3.23 ). To find the time in the system, -Insert the Information block fiom the Item library between the Step/Activity 3 block and the Exit block - Double click on the Create block. In the Options tab, check the window next to Timing attibute and click on the drop-down menu. Select New Value Attibute. You will be prompted to enter a New Value attibute. Type "Time System." -Double click on the Information block. In the Statistics tab, in the Cycle Time section, click on the timing attibute dropdown menu, and select "Time System." FIGURE 8.23 - Data entry process for audit claims. 1. The processing time for the first step follows a uniform distribution with (a) a minimum of 2 minutes and (b) a maximum of 4 minutes; the mean is (2+4)/2=3 minutes. To generate random numbers following a uniform distribution, use the following Excel function: Servicetime1=a+(RAND()(ba))=2+(RAND()(42)) 2. The processing time for the second step follows a normal distribution with a mean of 3 minutes and a standard deviation of 0.5 minute. To generate random numbers following a normal distribution, use the following Excel function: Service time 2= NORM.INV(RAND(), mean, standard deviation )= NORM.INV(RAND (),3,0.5). 3. The processing time for the third step follows a uniform distribution with (a) a minimum of 5 minutes and (b) a maximum of 8 minutes; the mean is (5+8)/2=6.5 minutes. To generate random numbers following a uniform distribution, use the following Excel function: Service time tim 3=a+(RAND()(ba))=5+(RAND()(85)). To keep this problem simple, we will assume that the interarrival time is 4 minutes and that this time is constant. The capacity at step 1 exceeds the demand (or arrivals); the capacity at step 2 exceeds the demand unless the service time is 2 or more standard deviations above the mean of 3 minutes; and the capacity at step 3 is insufficient to meet the demand. Therefore, step 3 is the bottleneck. As soon as they become available, the resources in step 1 start processing the arriving claims on an FCFS basis. In other words, in a traditional push system (see Chapter 6), the processing rate at step 1 governs the release of work into the system. The simulation of 10 and 1,000 claims is shown in Table 8.13. As you can see, there are no delays until the claims reach step 3Step by Step Solution
There are 3 Steps involved in it
Step: 1

Get Instant Access to Expert-Tailored Solutions
See step-by-step solutions with expert insights and AI powered tools for academic success
Step: 2

Step: 3
Ace Your Homework with AI
Get the answers you need in no time with our AI-driven, step-by-step assistance
Get Started
Financial Accounting
Authors: Jeffrey Waybright, Liang Hsuan Chen, Rhonda Pyper
1st Canadian Edition
9780132147538, 132889714, 013214753X , 978-0132889711