

Answered step by step
Verified Expert Solution
Question
1 Approved Answer
need explanation for the IDL code line by line ho a) What is the length of the main antenna lobe footprint (measured parallel to the
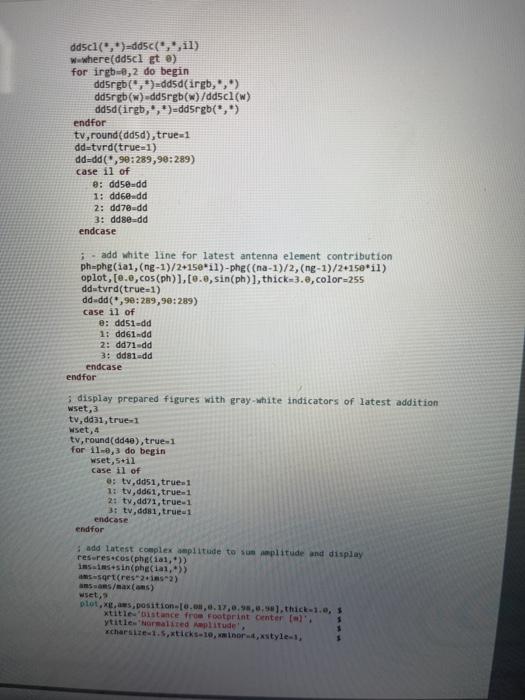
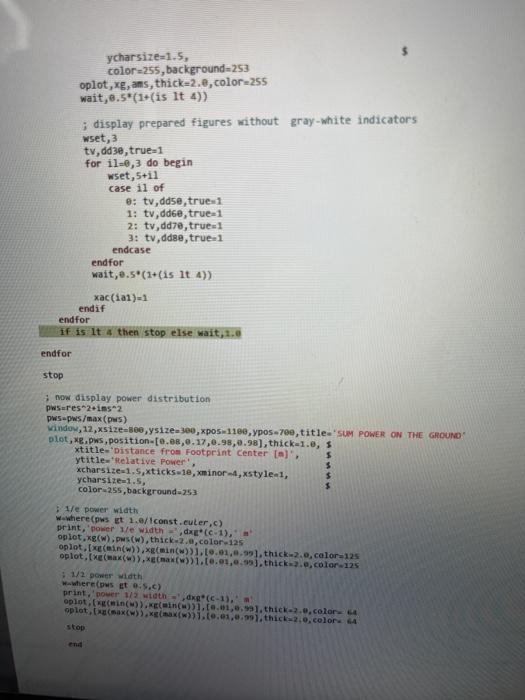
need explanation for the IDL code line by line
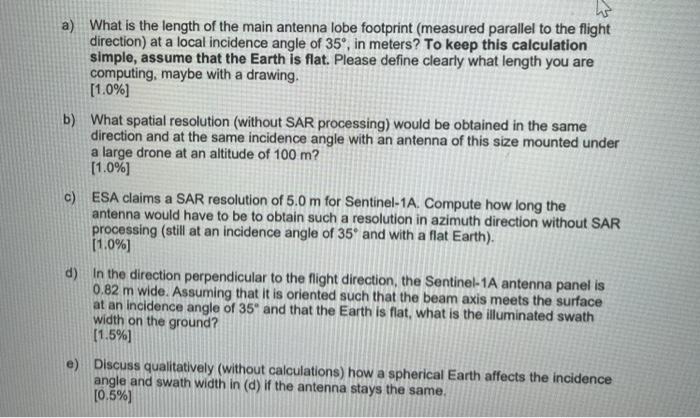
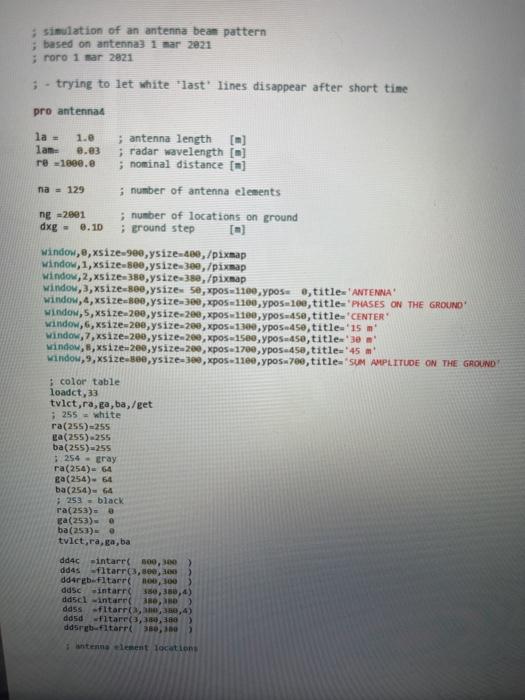
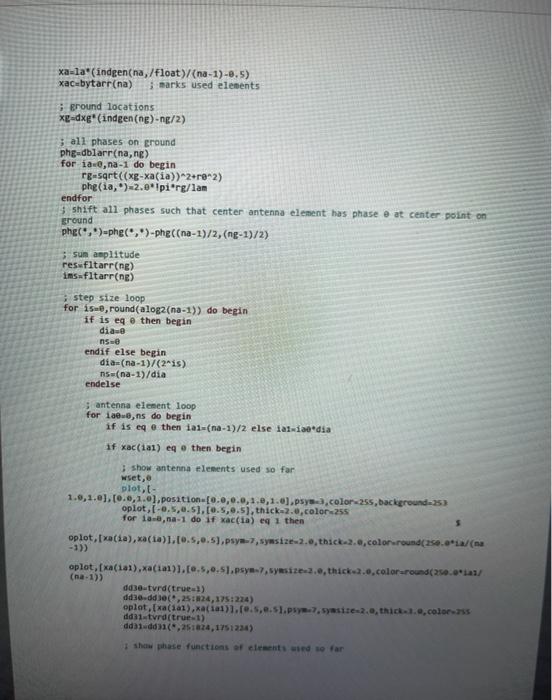
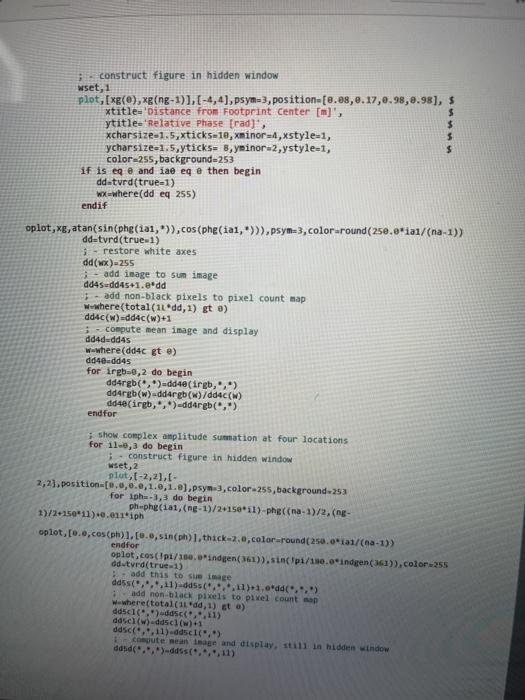
ho a) What is the length of the main antenna lobe footprint (measured parallel to the flight direction) at a local incidence angle of 35, in meters? To keep this calculation simple, assume that the Earth is flat. Please define clearly what length you are computing, maybe with a drawing. [1.0%) b) What spatial resolution (without SAR processing) would be obtained in the same direction and at the same incidence angle with an antenna of this size mounted under a large drone at an altitude of 100 m? (1.0%) c) ESA claims a SAR resolution of 5.0 m for Sentinel-1A. Compute how long the antenna would have to be to obtain such a resolution in azimuth direction without SAR processing (still at an incidence angle of 35 and with a flat Earth). (1.0%) d) in the direction perpendicular to the flight direction, the Sentinel-1A antenna panel is 0.82 m wide. Assuming that it is oriented such that the beam axis meets the surface at an incidence angle of 35 and that the Earth is flat, what is the illuminated swath width on the ground? [1.5%) e) Discuss qualitatively (without calculations) how a spherical Earth affects the incidence angle and swath width in (d) if the antenna stays the same. (0.5%) simulation of an antenna beam pattern ; based on antenna) 1 mar 2021 ; roro 1 sar 2021 ; - trying to let white 'last' lines disappear after short time pro antenna la = 1.0 ; antenna length lan 8.93 ; radar wavelength (m) re -1800. ; nominal distance (a) na = 129 ; number of antenna elements ng 2001 ; number of locations on ground dx = 0.10 ; ground step window, ,xsize-900,ysize:400,/pixmap window, 1,xsize-500,ysize-300,/pixmap window, 2, xsize380, ysize-380,/pixmap window,,size=800,ysize 58,xpos1100, yposo, title'ANTENNA window, 4,xsize=800,ysize: 300, xpos-1100, yposw100, title='PHASES ON THE GROUND window,5,xsize200, ysize-200,xpos 1100, yposse,title.'CENTER window, 6, xsize=200, ysize-200, xpos-1300, ypos450, title'15 m Window, 7, xsize:200,ysize.200, xpos1500, ypos450, title 30 m window, 8, xsize=200,ysize. 200, xpos=1700, ypos450, title-'45 m window, 9,xsize-300,ysize-300, xpos 1100, ypos700, title'SUM AMPLITUDE ON THE GROUND color table loadct, 33 tvict,ra, ga, ba,/get ; 255 = white ra(25%) 285 za(255) 255 ba(255)-255 5254 - gray ra(254)= 64 ga(254) 64 ba(254)- 64 ; 253 - black Ta(253)= 0 ga(253) ba(253) tvlct,raga, ba dd4c intare 100,300) dd45fltarr3,300, ddarebefltarr 100, 100 dosc intarr 350 ddse intare 30, ABD dass-fitarr(0,4) ddsdltare(30,380) ddsritarr 90,10 antenna element locations xa-la" (indgen(na, /float)/(na-1)-8.5) xacebytarr(na) jmarks used elements ; ground locations xg=dx g" (indigen (ng) -ng/2) ; all phases on ground phgdblarrena,ng) for 10:0, na-1 do begin rg-sqrt((xg-xa(ia))^2+ra-2) phe(ia,)-2.0"pi'rg/lam endfor $ shift all phases such that center antenna element has phase o at center point on ground phec,)-phg(*.*)-phgcna-1)/2, (ng-1)/2) sun amplitude res fltarr(ne) insufitarr(ne) step size loop for ise, round(alog2 (na-1)) do begin if is eq e then begin dia. ns. endif else begin dia (na-1)/(2*is) =(na-1)/dia endelse antenna element loop for 100,ns do begin if is eq e then iai-(na-1)/2 else ial-iaedia if xac (11) eq e then begin show antenna elements used so far wset, plott- 1.0,1.0), (0.0, 1.0),position 0.0.0.0, 1.0,1.0).psys), color-255, background-353 oplot, 1-0,5,0.5).(0.5, 0.5], thick-2.0, color-255 for 1a.a, na-1 do if xaccia) eq 1 then 5 oplot, xa (ia),x(ia)],[0.5,0.5).psy-7, synsize-2.0, thick-2.,color.round( 250.0*1/(na oplot, Ika(iai),xala.[0.5,0.51.psy-7. syesize2.,thick...color.round(230.11 Cha-1)) dd3o-tvrd(true) dd3.dd Dec, 25124,175:224) oplot, (xa(11), (iai).[9.5,0.5).psy-Syasite2., thick.colors dda tvrd(true 1) dda.dd 1,251824,1751234) show phase functions of elements wed so far construct figure in hidden window wset, 1 plot,[xg(0), xg(ng-1)],[-4,4), psym=3, position=[0.08,8.17,0.95,0.98], $ xtitle='distance from Footprint center [m]', ytitle="Relative Phase (rad), xcharsize-1.5,xticks-10, xminor-4,xstyle-1, ycharsize-1.5,yticks Byminor-2,ystyle-1, color-255, background253 if is eq@ and iae eq e then begin dd-tvrd(true-1) WX=where(dd eq 255) endir oplot,xg, atan(sin(phg(iai,)), cos(phe(iai, >>),psym3, color-round(250.0*1a1/(na-1)) ddetyrd(true 1) - restore white axes dd(x)=255 ; - add image to sun image dd4sudd45+1.8.dd 1. add non-black pixels to pixel count map Wewhere(total(11 dd, 2) gt o) dd4c(w)-dd4c(w)+1 - compute mean image and display dd4d-dd4s w-where(dd4c gt e) dd40dd4s for irgb-0,2 do begin dd4rgb()=dd4e(irgb,,) ddargb(w)-ddargb(W)/ddac (W) dd4e(irgb,,)ddargb(.) endfor ; show complex amplitude summation at four locations for 11-0,3 do begin 1.- construct figure in hidden window wset, 2 plot, 1-2,2), [- 2,2). position=[0,0,0.0, 1.0, 1.0).psy-3, color255, background-253 for ipha-3,3 do begin phuphe(ia, (ng-1)/2*150*11)-phe((na-1)/2, (ng- 1) 1+150*11) +0.811 iph oplot, Co.o.cos(ph) 1,[0.0, sin(ph)], thick-2.0, color-round( 250.0*1a/(1-1)) endfor oplot.cos(pi/100, o indgen(361)), sin pi/10.0"indigen(361)), color-255 dd tvrd(true) add this to su image ddssc... 11)-0d5s....1) 1.*dd(..) add non-black pixels to pixel count map w where(total(1100, 1) ste) dd5c1(*. ddc, 11) ddsel(w)-dd5c1()+1 ddsce.. 11)-dd5c1(",) compute meaning and display, still in hidden window ddsd(..*)-ddss(...,11) dd5c1(',')-dd5cil) wwwhere(ddscl gt ) for irgb-8,2 do begin ddSrgb(*)dd5d(ingb...) ddsrgb(w)-ddSrgb(W)/dd5c1(W) dddingb, , * )=ddSrgb(*, *) endfor tv,round(ddsd), true=1 dd-tvrd(trueel) dd=dd(,90:289,98:289) case il of e: dd5e.dd 1: dd6e-dd 2: dd7e-dd 3: ddsedd ; add white line for latest antenna element contribution ph=phg(iai, (ng-1)/2+150"il)-phg((na-1)/2, (ng-1)/2*150*il) oplot,[0.6, cos(ph)],[0.0, sin(ph)], thick 3.0,color-255 dd-tvrd(true 1) dddd(,90:289,90:289) case il of B: dd51-dd 1: dd61-da 2: dd71-dd 3: ddsladd endcase endfor 3 display prepared figures with gray-white indicators of latest addition wset, 3 tv, dd3i, true1 wset, 4 tv, round(dd40),true 1 for 11.,3 do begin wset,5til case il of e tv,dd51, true 1 11 tv, dd61, true 1 21 tv, dd71, true-1 3: tv, dd81, true 1 endcase endfor add latest complex amplitude to sue amplitude and display resures.cos(phelia,) insi+sin(phecial,) sqrt(res"2.12) amas/max (ons) wset, plot,,,position 10.0.17.0.98,0.9).thick 1., xtitle'oistance from Footprint Center all ytitles horaired amplitude xcharsize:1.5.ticks19, minor, style, 1 ycharsize 1.5, color-255, background=253 oplot, xg, ams, thick-2.8, color-255 wait,8.5*(1+(is It 4)) ; display prepared figures without gray-white indicators wset, 3 tv, dd3e, true 1 for il-6,3 do begin wset, 5 il case il of e: tv, dd5e,true 1 1: tv,dd6e, true-1 2: tv,dd7e, true 1 3: tv,ddse, true-1 endcase endfor wait,8.5*(1+(is it 4)) xc (la1)=1 endir endfor if is It 4 then stop else wait, 1.0 endfor stop now display power distribution pwsures2.ins2 wspws/max(s) Window, 12,xsize-300, ysize300, xpos:1100, ypos700, title="SUM POWER ON THE GROUND plot, .pws,position [0.08,0.17,0.98,0.98), thick-1.0, $ xtitle-Distance from Footprint Center [n), $ ytitle="Relative Power, $ xcharsize 1.5,xticks 1e, xminor-4,xstyle 1, yCharsize 1.5, $ color-255, background.253 1/e power width w where(pws et 1./iconst.culer,c) print, power we width="d(0-1). oplot, g(w). (w), thick 2.0, color-125 oplot.Ix(i)),x(incl.10.01,0.9), thick 2.0, color-125 oplot. (max()),(max())1.10.1,0.5], thick, color-125 1/2 power width wwwhere (pws et .5.c) print, power 1/2 width="dxg(0-1). oplot.in()). Emin()).[9.01,0.9).thick...color oplot. x)),x(w)).10.01,0.99), thick-2.0, color 44 end ho a) What is the length of the main antenna lobe footprint (measured parallel to the flight direction) at a local incidence angle of 35, in meters? To keep this calculation simple, assume that the Earth is flat. Please define clearly what length you are computing, maybe with a drawing. [1.0%) b) What spatial resolution (without SAR processing) would be obtained in the same direction and at the same incidence angle with an antenna of this size mounted under a large drone at an altitude of 100 m? (1.0%) c) ESA claims a SAR resolution of 5.0 m for Sentinel-1A. Compute how long the antenna would have to be to obtain such a resolution in azimuth direction without SAR processing (still at an incidence angle of 35 and with a flat Earth). (1.0%) d) in the direction perpendicular to the flight direction, the Sentinel-1A antenna panel is 0.82 m wide. Assuming that it is oriented such that the beam axis meets the surface at an incidence angle of 35 and that the Earth is flat, what is the illuminated swath width on the ground? [1.5%) e) Discuss qualitatively (without calculations) how a spherical Earth affects the incidence angle and swath width in (d) if the antenna stays the same. (0.5%) simulation of an antenna beam pattern ; based on antenna) 1 mar 2021 ; roro 1 sar 2021 ; - trying to let white 'last' lines disappear after short time pro antenna la = 1.0 ; antenna length lan 8.93 ; radar wavelength (m) re -1800. ; nominal distance (a) na = 129 ; number of antenna elements ng 2001 ; number of locations on ground dx = 0.10 ; ground step window, ,xsize-900,ysize:400,/pixmap window, 1,xsize-500,ysize-300,/pixmap window, 2, xsize380, ysize-380,/pixmap window,,size=800,ysize 58,xpos1100, yposo, title'ANTENNA window, 4,xsize=800,ysize: 300, xpos-1100, yposw100, title='PHASES ON THE GROUND window,5,xsize200, ysize-200,xpos 1100, yposse,title.'CENTER window, 6, xsize=200, ysize-200, xpos-1300, ypos450, title'15 m Window, 7, xsize:200,ysize.200, xpos1500, ypos450, title 30 m window, 8, xsize=200,ysize. 200, xpos=1700, ypos450, title-'45 m window, 9,xsize-300,ysize-300, xpos 1100, ypos700, title'SUM AMPLITUDE ON THE GROUND color table loadct, 33 tvict,ra, ga, ba,/get ; 255 = white ra(25%) 285 za(255) 255 ba(255)-255 5254 - gray ra(254)= 64 ga(254) 64 ba(254)- 64 ; 253 - black Ta(253)= 0 ga(253) ba(253) tvlct,raga, ba dd4c intare 100,300) dd45fltarr3,300, ddarebefltarr 100, 100 dosc intarr 350 ddse intare 30, ABD dass-fitarr(0,4) ddsdltare(30,380) ddsritarr 90,10 antenna element locations xa-la" (indgen(na, /float)/(na-1)-8.5) xacebytarr(na) jmarks used elements ; ground locations xg=dx g" (indigen (ng) -ng/2) ; all phases on ground phgdblarrena,ng) for 10:0, na-1 do begin rg-sqrt((xg-xa(ia))^2+ra-2) phe(ia,)-2.0"pi'rg/lam endfor $ shift all phases such that center antenna element has phase o at center point on ground phec,)-phg(*.*)-phgcna-1)/2, (ng-1)/2) sun amplitude res fltarr(ne) insufitarr(ne) step size loop for ise, round(alog2 (na-1)) do begin if is eq e then begin dia. ns. endif else begin dia (na-1)/(2*is) =(na-1)/dia endelse antenna element loop for 100,ns do begin if is eq e then iai-(na-1)/2 else ial-iaedia if xac (11) eq e then begin show antenna elements used so far wset, plott- 1.0,1.0), (0.0, 1.0),position 0.0.0.0, 1.0,1.0).psys), color-255, background-353 oplot, 1-0,5,0.5).(0.5, 0.5], thick-2.0, color-255 for 1a.a, na-1 do if xaccia) eq 1 then 5 oplot, xa (ia),x(ia)],[0.5,0.5).psy-7, synsize-2.0, thick-2.,color.round( 250.0*1/(na oplot, Ika(iai),xala.[0.5,0.51.psy-7. syesize2.,thick...color.round(230.11 Cha-1)) dd3o-tvrd(true) dd3.dd Dec, 25124,175:224) oplot, (xa(11), (iai).[9.5,0.5).psy-Syasite2., thick.colors dda tvrd(true 1) dda.dd 1,251824,1751234) show phase functions of elements wed so far construct figure in hidden window wset, 1 plot,[xg(0), xg(ng-1)],[-4,4), psym=3, position=[0.08,8.17,0.95,0.98], $ xtitle='distance from Footprint center [m]', ytitle="Relative Phase (rad), xcharsize-1.5,xticks-10, xminor-4,xstyle-1, ycharsize-1.5,yticks Byminor-2,ystyle-1, color-255, background253 if is eq@ and iae eq e then begin dd-tvrd(true-1) WX=where(dd eq 255) endir oplot,xg, atan(sin(phg(iai,)), cos(phe(iai, >>),psym3, color-round(250.0*1a1/(na-1)) ddetyrd(true 1) - restore white axes dd(x)=255 ; - add image to sun image dd4sudd45+1.8.dd 1. add non-black pixels to pixel count map Wewhere(total(11 dd, 2) gt o) dd4c(w)-dd4c(w)+1 - compute mean image and display dd4d-dd4s w-where(dd4c gt e) dd40dd4s for irgb-0,2 do begin dd4rgb()=dd4e(irgb,,) ddargb(w)-ddargb(W)/ddac (W) dd4e(irgb,,)ddargb(.) endfor ; show complex amplitude summation at four locations for 11-0,3 do begin 1.- construct figure in hidden window wset, 2 plot, 1-2,2), [- 2,2). position=[0,0,0.0, 1.0, 1.0).psy-3, color255, background-253 for ipha-3,3 do begin phuphe(ia, (ng-1)/2*150*11)-phe((na-1)/2, (ng- 1) 1+150*11) +0.811 iph oplot, Co.o.cos(ph) 1,[0.0, sin(ph)], thick-2.0, color-round( 250.0*1a/(1-1)) endfor oplot.cos(pi/100, o indgen(361)), sin pi/10.0"indigen(361)), color-255 dd tvrd(true) add this to su image ddssc... 11)-0d5s....1) 1.*dd(..) add non-black pixels to pixel count map w where(total(1100, 1) ste) dd5c1(*. ddc, 11) ddsel(w)-dd5c1()+1 ddsce.. 11)-dd5c1(",) compute meaning and display, still in hidden window ddsd(..*)-ddss(...,11) dd5c1(',')-dd5cil) wwwhere(ddscl gt ) for irgb-8,2 do begin ddSrgb(*)dd5d(ingb...) ddsrgb(w)-ddSrgb(W)/dd5c1(W) dddingb, , * )=ddSrgb(*, *) endfor tv,round(ddsd), true=1 dd-tvrd(trueel) dd=dd(,90:289,98:289) case il of e: dd5e.dd 1: dd6e-dd 2: dd7e-dd 3: ddsedd ; add white line for latest antenna element contribution ph=phg(iai, (ng-1)/2+150"il)-phg((na-1)/2, (ng-1)/2*150*il) oplot,[0.6, cos(ph)],[0.0, sin(ph)], thick 3.0,color-255 dd-tvrd(true 1) dddd(,90:289,90:289) case il of B: dd51-dd 1: dd61-da 2: dd71-dd 3: ddsladd endcase endfor 3 display prepared figures with gray-white indicators of latest addition wset, 3 tv, dd3i, true1 wset, 4 tv, round(dd40),true 1 for 11.,3 do begin wset,5til case il of e tv,dd51, true 1 11 tv, dd61, true 1 21 tv, dd71, true-1 3: tv, dd81, true 1 endcase endfor add latest complex amplitude to sue amplitude and display resures.cos(phelia,) insi+sin(phecial,) sqrt(res"2.12) amas/max (ons) wset, plot,,,position 10.0.17.0.98,0.9).thick 1., xtitle'oistance from Footprint Center all ytitles horaired amplitude xcharsize:1.5.ticks19, minor, style, 1 ycharsize 1.5, color-255, background=253 oplot, xg, ams, thick-2.8, color-255 wait,8.5*(1+(is It 4)) ; display prepared figures without gray-white indicators wset, 3 tv, dd3e, true 1 for il-6,3 do begin wset, 5 il case il of e: tv, dd5e,true 1 1: tv,dd6e, true-1 2: tv,dd7e, true 1 3: tv,ddse, true-1 endcase endfor wait,8.5*(1+(is it 4)) xc (la1)=1 endir endfor if is It 4 then stop else wait, 1.0 endfor stop now display power distribution pwsures2.ins2 wspws/max(s) Window, 12,xsize-300, ysize300, xpos:1100, ypos700, title="SUM POWER ON THE GROUND plot, .pws,position [0.08,0.17,0.98,0.98), thick-1.0, $ xtitle-Distance from Footprint Center [n), $ ytitle="Relative Power, $ xcharsize 1.5,xticks 1e, xminor-4,xstyle 1, yCharsize 1.5, $ color-255, background.253 1/e power width w where(pws et 1./iconst.culer,c) print, power we width="d(0-1). oplot, g(w). (w), thick 2.0, color-125 oplot.Ix(i)),x(incl.10.01,0.9), thick 2.0, color-125 oplot. (max()),(max())1.10.1,0.5], thick, color-125 1/2 power width wwwhere (pws et .5.c) print, power 1/2 width="dxg(0-1). oplot.in()). Emin()).[9.01,0.9).thick...color oplot. x)),x(w)).10.01,0.99), thick-2.0, color 44 end Step by Step Solution
There are 3 Steps involved in it
Step: 1

Get Instant Access to Expert-Tailored Solutions
See step-by-step solutions with expert insights and AI powered tools for academic success
Step: 2

Step: 3
Ace Your Homework with AI
Get the answers you need in no time with our AI-driven, step-by-step assistance
Get Started
Joe Celkos Data And Databases Concepts In Practice
Authors: Joe Celko
1st Edition
1558604324, 978-1558604322