

Question
Need help asap!!! HELP!!!! a) complete an analysis for Falcon Inc b) how would you assess the performance of the division managers in Mexico, Denmark,
Need help asap!!! HELP!!!!
a) complete an analysis for Falcon Inc
b) how would you assess the performance of the division managers in Mexico, Denmark, and Japan? Which would receive the highest and lowest bonuses?
c) If ROI rather than profit margin was used as a performance measure, would the performance ranking of each subsidary be different? What are
the advantages and limitations of using ROI over profit margin? Would ROI be a superior performance metric??
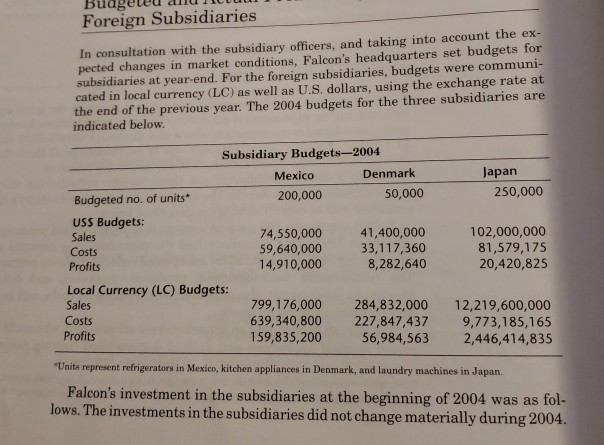
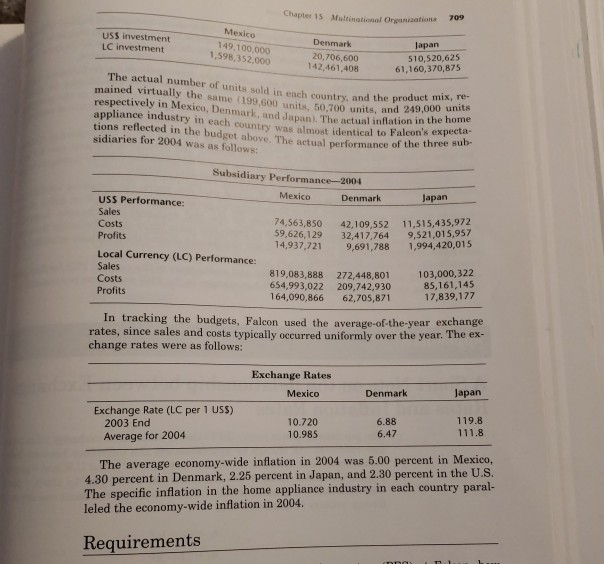
Chapter 15 Multinational Organizations 709 Mexico USS investment LC investment Denmark 20,706,600 142,461,408 Japan 149,100,000 1,598,352,000 510,520,625 61,160,370,875 The actual number of units sold in each country, and the produe mained virtually the same (199,600 units, 50,700 units, an respectively in Mexico, Denmark, and Japan). The actual inflation in appliance industry in each country was almost identical to Falcon tions reflected in the budget above. The actual performance o sidiaries for 2004 was as follows: mix, re- 49,000 units the three sub- Subsidiary Performance-2004 Denmark Japan USS Performance: Sales Costs Profits 74,563,850 42,109,552 11,515,435,972 59,626,129 32,417,764 9,521,015,957 14,937,721 9,691,788 1,994,420,015 Local Currency (LC) Performance: Sales Costs Profits 819,083,888 272,448,801 103,000,322 654,993,022 209,742,930 164,090,866 62,705,871 85,161,145 17,839,177 In tracking the budgets, Falcon used the average-of-the-year exchange rates, since sales and costs typically occurred uniformly over the year. The ex- change rates were as follows: Exchange Rates Mexico Denmark Japan Exchange Rate (LC per 1 USS) 119.8 10.720 10.985 6.88 6.47 2003 End Average for 2004 The average economy-wide inflation in 2004 was 5.00 percent in Mexico, 4.30 percent in Denmark, 2.25 percent in Japan, and 2.30 percent in the U.S. The specific inflation in the home appliance industry in each country paral- leled the economy-wide inflation in 2004. Requirements Chapter 15 Multinational Organizations 709 Mexico USS investment LC investment Denmark 20,706,600 142,461,408 Japan 149,100,000 1,598,352,000 510,520,625 61,160,370,875 The actual number of units sold in each country, and the produe mained virtually the same (199,600 units, 50,700 units, an respectively in Mexico, Denmark, and Japan). The actual inflation in appliance industry in each country was almost identical to Falcon tions reflected in the budget above. The actual performance o sidiaries for 2004 was as follows: mix, re- 49,000 units the three sub- Subsidiary Performance-2004 Denmark Japan USS Performance: Sales Costs Profits 74,563,850 42,109,552 11,515,435,972 59,626,129 32,417,764 9,521,015,957 14,937,721 9,691,788 1,994,420,015 Local Currency (LC) Performance: Sales Costs Profits 819,083,888 272,448,801 103,000,322 654,993,022 209,742,930 164,090,866 62,705,871 85,161,145 17,839,177 In tracking the budgets, Falcon used the average-of-the-year exchange rates, since sales and costs typically occurred uniformly over the year. The ex- change rates were as follows: Exchange Rates Mexico Denmark Japan Exchange Rate (LC per 1 USS) 119.8 10.720 10.985 6.88 6.47 2003 End Average for 2004 The average economy-wide inflation in 2004 was 5.00 percent in Mexico, 4.30 percent in Denmark, 2.25 percent in Japan, and 2.30 percent in the U.S. The specific inflation in the home appliance industry in each country paral- leled the economy-wide inflation in 2004. Requirements
Step by Step Solution
There are 3 Steps involved in it
Step: 1

Get Instant Access to Expert-Tailored Solutions
See step-by-step solutions with expert insights and AI powered tools for academic success
Step: 2

Step: 3
Ace Your Homework with AI
Get the answers you need in no time with our AI-driven, step-by-step assistance
Get Started
How To Be A Finance Rock Star
Authors: Nicole A Fende, Carol Roth
1st Edition
0983765901, 978-0983765905