

Answered step by step
Verified Expert Solution
Question
1 Approved Answer
need help can you show how to do this by hand. will thumbs up! The data in the following table were obtained during a colorimetric
need help can you show how to do this by hand. will thumbs up! 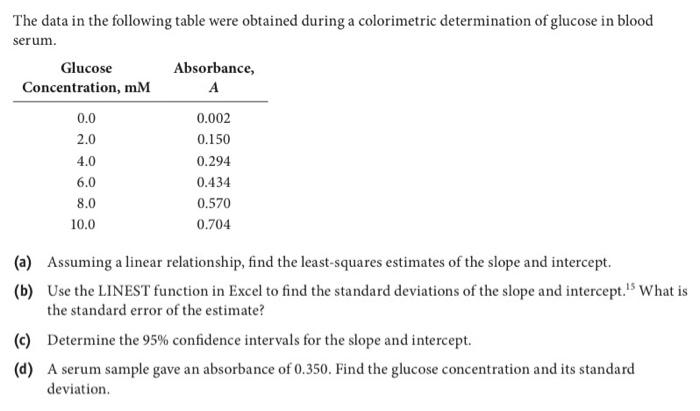
The data in the following table were obtained during a colorimetric determination of glucose in blood serum. (a) Assuming a linear relationship, find the least-squares estimates of the slope and intercept. (b) Use the LINEST function in Excel to find the standard deviations of the slope and intercept. 15 What i the standard error of the estimate? (c) Determine the 95% confidence intervals for the slope and intercept. (d) A serum sample gave an absorbance of 0.350. Find the glucose concentration and its standard deviation Step by Step Solution
There are 3 Steps involved in it
Step: 1

Get Instant Access to Expert-Tailored Solutions
See step-by-step solutions with expert insights and AI powered tools for academic success
Step: 2

Step: 3
Ace Your Homework with AI
Get the answers you need in no time with our AI-driven, step-by-step assistance
Get Started
Chemistry
Authors: Bryan Earl, Doug Wilford
3rd Edition
1444176447, 978-1444176445