 Need help filling in the 3 sheets
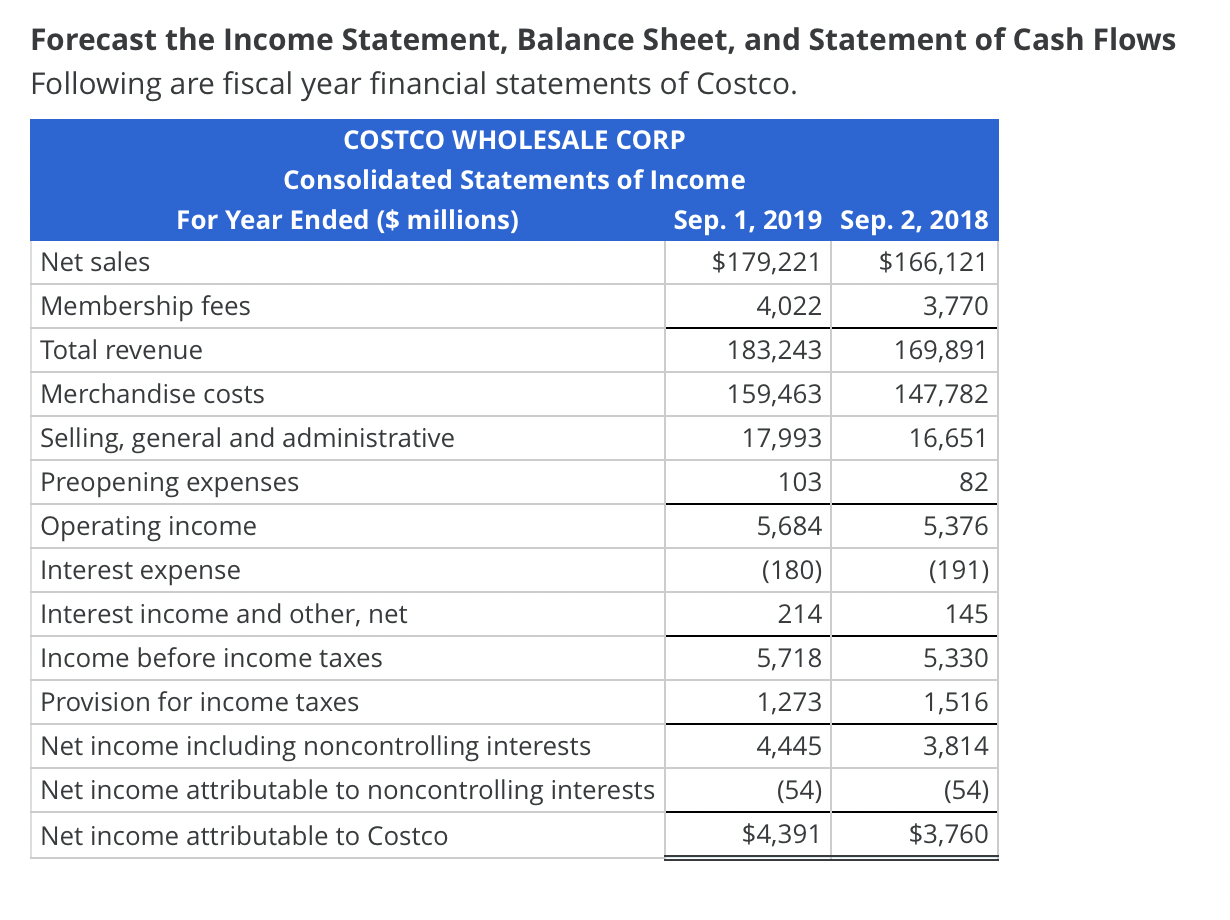
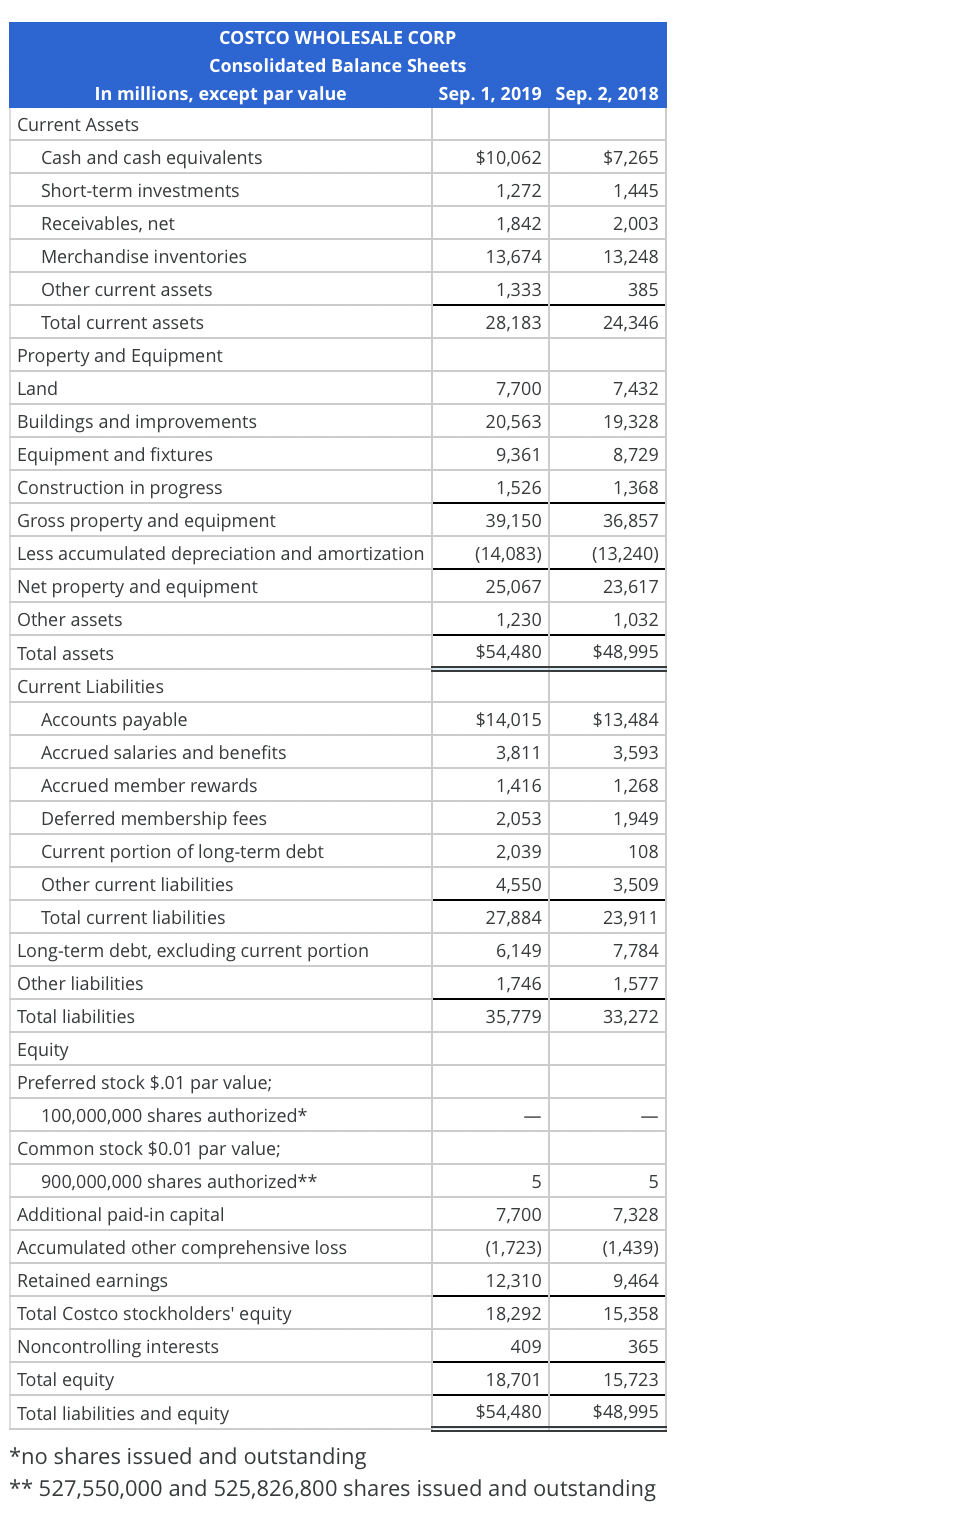
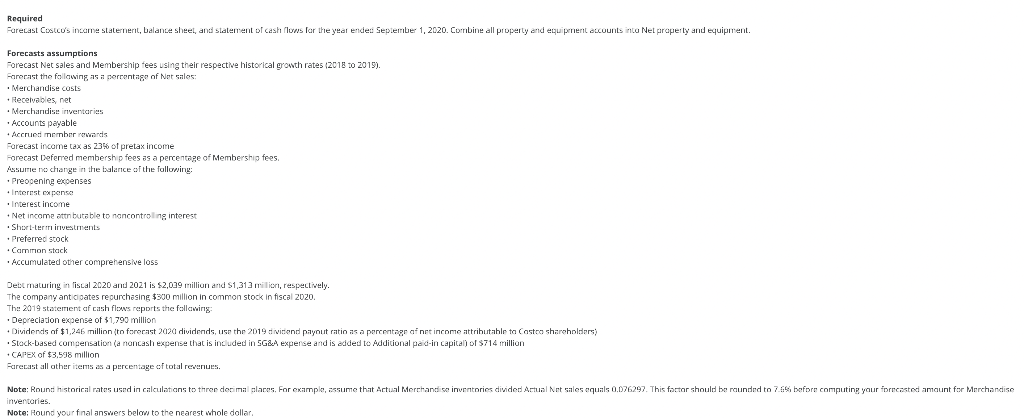
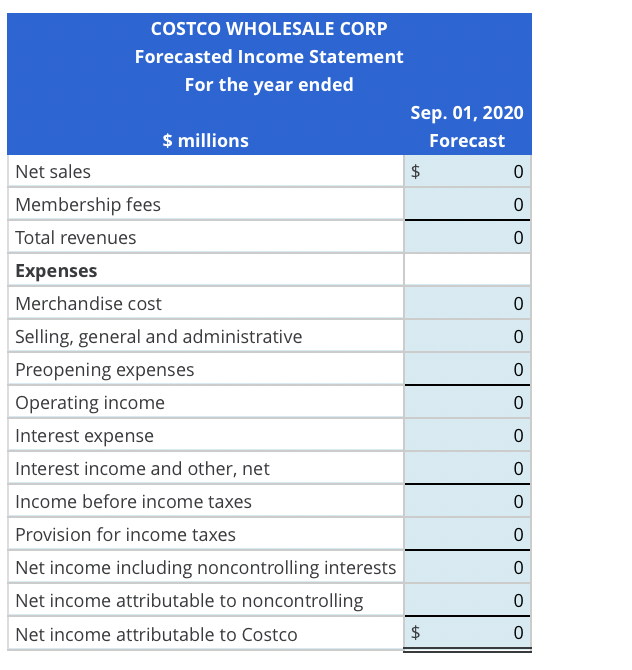
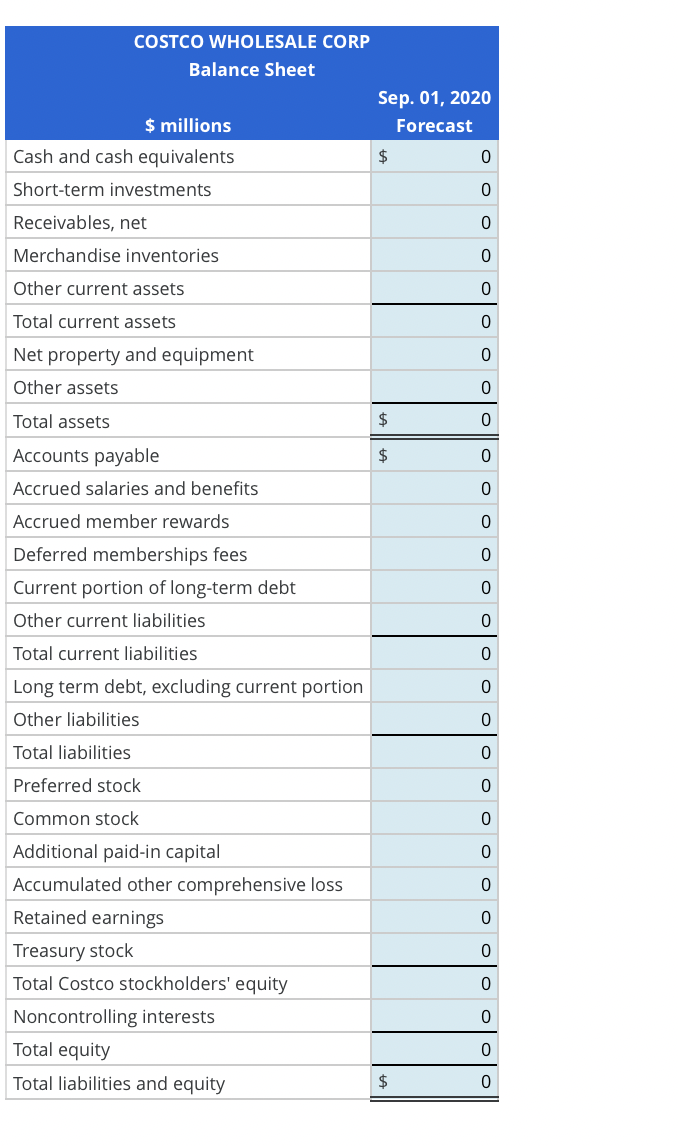
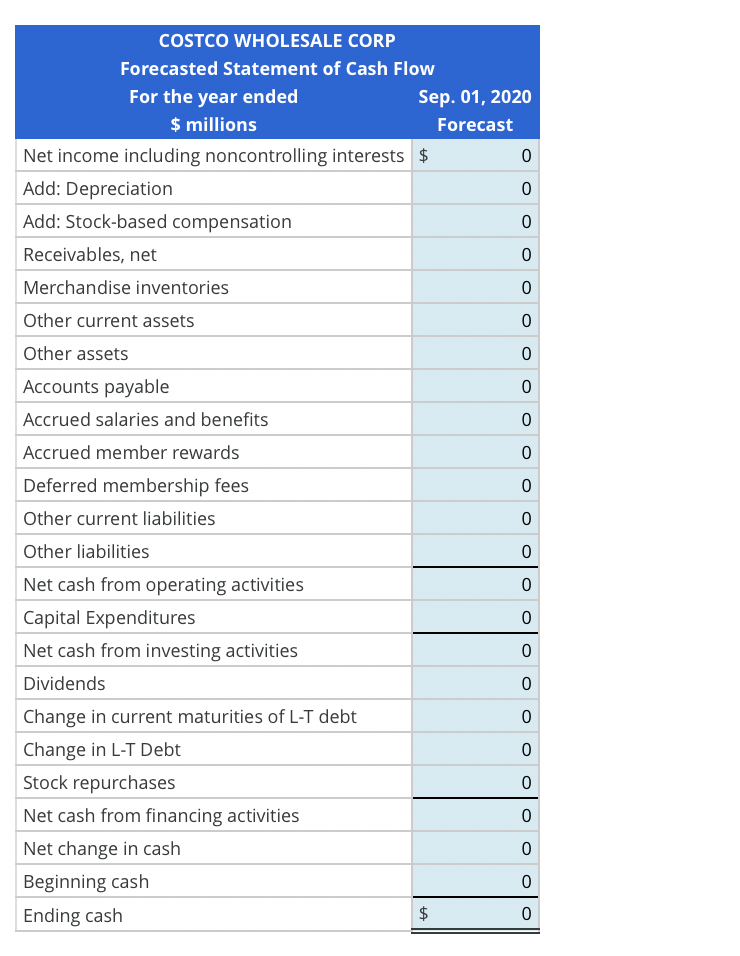
Forecast the Income Statement, Balance Sheet, and Statement of Cash Flows Following are fiscal year financial statements of Costco. COSTCO WHOLESALE CORP Consolidated Statements of Income For Year Ended ($ millions) Net sales Membership fees Total revenue Merchandise costs Selling, general and administrative Preopening expenses Operating income Interest expense Interest income and other, net Income before income taxes Provision for income taxes Net income including noncontrolling interests Net income attributable to noncontrolling interests Net income attributable to Costco Sep. 1, 2019 Sep. 2, 2018 $179,221 $166,121 4,022 183,243 159,463 17,993 103 5,684 (180) 214 5,718 1,273 4,445 (54) $4,391 3,770 169,891 147,782 16,651 82 5,376 (191) 145 5,330 1,516 3,814 (54) $3,760 COSTCO WHOLESALE CORP Consolidated Balance Sheets In millions, except par value Current Assets Cash and cash equivalents Short-term investments Receivables, net Merchandise inventories Other current assets Total current assets Property and Equipment Land Buildings and improvements Equipment and fixtures Construction in progress Gross property and equipment Less accumulated depreciation and amortization Net property and equipment Other assets Total assets Current Liabilities Accounts payable Accrued salaries and benefits Accrued member rewards Deferred membership fees Current portion of long-term debt Other current liabilities Total current liabilities Long-term debt, excluding current portion Other liabilities Total liabilities Equity Preferred stock $.01 par value; 100,000,000 shares authorized* Common stock $0.01 par value; 900,000,000 shares authorized** Additional paid-in capital Accumulated other comprehensive loss Retained earnings Total Costco stockholders' equity Noncontrolling interests Total equity Total liabilities and equity Sep. 1, 2019 Sep. 2, 2018 $10,062 1,272 1,842 13,674 1,333 28,183 7,700 20,563 9,361 1,526 39,150 (14,083) 25,067 1,230 $54,480 $14,015 3,811 1,416 2,053 2,039 4,550 27,884 6,149 1,746 35,779 5 7,700 (1,723) 12,310 18,292 409 18,701 $54,480 $7,265 1,445 2,003 13,248 385 24,346 7,432 19,328 8,729 1,368 36,857 (13,240) 23,617 1,032 $48,995 $13,484 3,593 1,268 1,949 108 3,509 23,911 7,784 1,577 33,272 5 7,328 (1,439) 9,464 15,358 365 15,723 $48,995 *no shares issued and outstanding ** 527,550,000 and 525,826,800 shares issued and outstanding Required Forecast Costco's income statement, balance sheet, and statement of cash flows for the year ended September 1, 2020. Combine all property and equipment accounts into Net property and equipment. Forecasts assumptions Forecast Net sales and Membership fees using their respective historical growth rates (2018 to 2015). Forecast the following as a percentage of Net sales: Merchandise costs Receivables, net Merchandise inventaries Accounts payable + Accrued member rewards Forecast income tax as 23% of pretax income Forecast Deferred membership fees as a percentage of Membership fees. Assume no change in the balance of the following: Preopening expenses Interest expense Interest income *Net income attributable to noncontrolling interest Short-term investments Preferred stock Cammon stack Accumulated other comprehensive loss Debt maturing in fiscal 2020 and 2021 is $2,039 million and $1,313 million, respectively. The company anticipates repurchasing $300 million in common stock in fiscal 2020. The 2019 statement of cash flows reports the following: Depreciation expense of $1,790 million + Dividends of $1,246 million (to forecast 2020 dividends, use the 2019 dividend payout ratio as a percentage of net income attributable to Castro shareholders) Stock-based compensation (a noncash expense that is included in SG&A expense and is added to Additional paid-in capital) of $714 million CAPEX of $3,598 million Forecast all other items as a percentage of total revenues. Note: Round historical rates used in calculations to three decimal places. For example, assume that Actual Merchandise inventories divided Actual Net sales equals 0.076297. This factor should be rounded to 7.6% before computing your forecasted amount for Merchandise inventories. Note: Round your final answers below to the nearest whole dollar. COSTCO WHOLESALE CORP Forecasted Income Statement For the year ended $ millions Net sales Membership fees Total revenues Expenses Merchandise cost Selling, general and administrative Preopening expenses Operating income Interest expense Interest income and other, net Income before income taxes Provision for income taxes Net income including noncontrolling interests Net income attributable to noncontrolling Net income attributable to Costco Sep. 01, 2020 Forecast $ $ 0 0 0 0 0 0 0 0 0 0 0 0 0 0 COSTCO WHOLESALE CORP Balance Sheet $ millions Cash and cash equivalents Short-term investments Receivables, net Merchandise inventories Other current assets Total current assets Net property and equipment Other assets Total assets Accounts payable Accrued salaries and benefits Accrued member rewards Deferred memberships fees Current portion of long-term debt Other current liabilities Total current liabilities Long term debt, excluding current portion Other liabilities Total liabilities Preferred stock Common stock Additional paid-in capital Accumulated other comprehensive loss Retained earnings Treasury stock Total Costco stockholders' equity Noncontrolling interests Total equity Total liabilities and equity Sep. 01, 2020 Forecast $ $ $ $ 0 0 0 OOO O 0 0 0 0 0 0 0 0 0 0 0 0 0 0 OOO OOO 0 0 0 0 0 COSTCO WHOLESALE CORP Forecasted Statement of Cash Flow For the year ended $ millions Net income including noncontrolling interests $ Add: Depreciation Add: Stock-based compensation Receivables, net Merchandise inventories Sep. 01, 2020 Forecast Other current assets Other assets Accounts payable Accrued salaries and benefits Accrued member rewards Deferred membership fees Other current liabilities Other liabilities Net cash from operating activities Capital Expenditures Net cash from investing activities Dividends Change in current maturities of L-T debt Change in L-T Debt Stock repurchases Net cash from financing activities Net change in cash Beginning cash Ending cash $ LA 0 0 0 0 0 0 0 0 0 0 0 0 0 0 0 0 0 0 0 0 0 0 0 0 Forecast the Income Statement, Balance Sheet, and Statement of Cash Flows Following are fiscal year financial statements of Costco. COSTCO WHOLESALE CORP Consolidated Statements of Income For Year Ended ($ millions) Net sales Membership fees Total revenue Merchandise costs Selling, general and administrative Preopening expenses Operating income Interest expense Interest income and other, net Income before income taxes Provision for income taxes Net income including noncontrolling interests Net income attributable to noncontrolling interests Net income attributable to Costco Sep. 1, 2019 Sep. 2, 2018 $179,221 $166,121 4,022 183,243 159,463 17,993 103 5,684 (180) 214 5,718 1,273 4,445 (54) $4,391 3,770 169,891 147,782 16,651 82 5,376 (191) 145 5,330 1,516 3,814 (54) $3,760 COSTCO WHOLESALE CORP Consolidated Balance Sheets In millions, except par value Current Assets Cash and cash equivalents Short-term investments Receivables, net Merchandise inventories Other current assets Total current assets Property and Equipment Land Buildings and improvements Equipment and fixtures Construction in progress Gross property and equipment Less accumulated depreciation and amortization Net property and equipment Other assets Total assets Current Liabilities Accounts payable Accrued salaries and benefits Accrued member rewards Deferred membership fees Current portion of long-term debt Other current liabilities Total current liabilities Long-term debt, excluding current portion Other liabilities Total liabilities Equity Preferred stock $.01 par value; 100,000,000 shares authorized* Common stock $0.01 par value; 900,000,000 shares authorized** Additional paid-in capital Accumulated other comprehensive loss Retained earnings Total Costco stockholders' equity Noncontrolling interests Total equity Total liabilities and equity Sep. 1, 2019 Sep. 2, 2018 $10,062 1,272 1,842 13,674 1,333 28,183 7,700 20,563 9,361 1,526 39,150 (14,083) 25,067 1,230 $54,480 $14,015 3,811 1,416 2,053 2,039 4,550 27,884 6,149 1,746 35,779 5 7,700 (1,723) 12,310 18,292 409 18,701 $54,480 $7,265 1,445 2,003 13,248 385 24,346 7,432 19,328 8,729 1,368 36,857 (13,240) 23,617 1,032 $48,995 $13,484 3,593 1,268 1,949 108 3,509 23,911 7,784 1,577 33,272 5 7,328 (1,439) 9,464 15,358 365 15,723 $48,995 *no shares issued and outstanding ** 527,550,000 and 525,826,800 shares issued and outstanding Required Forecast Costco's income statement, balance sheet, and statement of cash flows for the year ended September 1, 2020. Combine all property and equipment accounts into Net property and equipment. Forecasts assumptions Forecast Net sales and Membership fees using their respective historical growth rates (2018 to 2015). Forecast the following as a percentage of Net sales: Merchandise costs Receivables, net Merchandise inventaries Accounts payable + Accrued member rewards Forecast income tax as 23% of pretax income Forecast Deferred membership fees as a percentage of Membership fees. Assume no change in the balance of the following: Preopening expenses Interest expense Interest income *Net income attributable to noncontrolling interest Short-term investments Preferred stock Cammon stack Accumulated other comprehensive loss Debt maturing in fiscal 2020 and 2021 is $2,039 million and $1,313 million, respectively. The company anticipates repurchasing $300 million in common stock in fiscal 2020. The 2019 statement of cash flows reports the following: Depreciation expense of $1,790 million + Dividends of $1,246 million (to forecast 2020 dividends, use the 2019 dividend payout ratio as a percentage of net income attributable to Castro shareholders) Stock-based compensation (a noncash expense that is included in SG&A expense and is added to Additional paid-in capital) of $714 million CAPEX of $3,598 million Forecast all other items as a percentage of total revenues. Note: Round historical rates used in calculations to three decimal places. For example, assume that Actual Merchandise inventories divided Actual Net sales equals 0.076297. This factor should be rounded to 7.6% before computing your forecasted amount for Merchandise inventories. Note: Round your final answers below to the nearest whole dollar. COSTCO WHOLESALE CORP Forecasted Income Statement For the year ended $ millions Net sales Membership fees Total revenues Expenses Merchandise cost Selling, general and administrative Preopening expenses Operating income Interest expense Interest income and other, net Income before income taxes Provision for income taxes Net income including noncontrolling interests Net income attributable to noncontrolling Net income attributable to Costco Sep. 01, 2020 Forecast $ $ 0 0 0 0 0 0 0 0 0 0 0 0 0 0 COSTCO WHOLESALE CORP Balance Sheet $ millions Cash and cash equivalents Short-term investments Receivables, net Merchandise inventories Other current assets Total current assets Net property and equipment Other assets Total assets Accounts payable Accrued salaries and benefits Accrued member rewards Deferred memberships fees Current portion of long-term debt Other current liabilities Total current liabilities Long term debt, excluding current portion Other liabilities Total liabilities Preferred stock Common stock Additional paid-in capital Accumulated other comprehensive loss Retained earnings Treasury stock Total Costco stockholders' equity Noncontrolling interests Total equity Total liabilities and equity Sep. 01, 2020 Forecast $ $ $ $ 0 0 0 OOO O 0 0 0 0 0 0 0 0 0 0 0 0 0 0 OOO OOO 0 0 0 0 0 COSTCO WHOLESALE CORP Forecasted Statement of Cash Flow For the year ended $ millions Net income including noncontrolling interests $ Add: Depreciation Add: Stock-based compensation Receivables, net Merchandise inventories Sep. 01, 2020 Forecast Other current assets Other assets Accounts payable Accrued salaries and benefits Accrued member rewards Deferred membership fees Other current liabilities Other liabilities Net cash from operating activities Capital Expenditures Net cash from investing activities Dividends Change in current maturities of L-T debt Change in L-T Debt Stock repurchases Net cash from financing activities Net change in cash Beginning cash Ending cash $ LA 0 0 0 0 0 0 0 0 0 0 0 0 0 0 0 0 0 0 0 0 0 0 0 0


 Need help filling in the 3 sheets


