Answered step by step
Verified Expert Solution
Link Copied!

Question

1 Approved Answer

Need help in less than an hour please 4. The following data are number of redundant records that were collected from a data warehouse. Set

Need help in less than an hour please
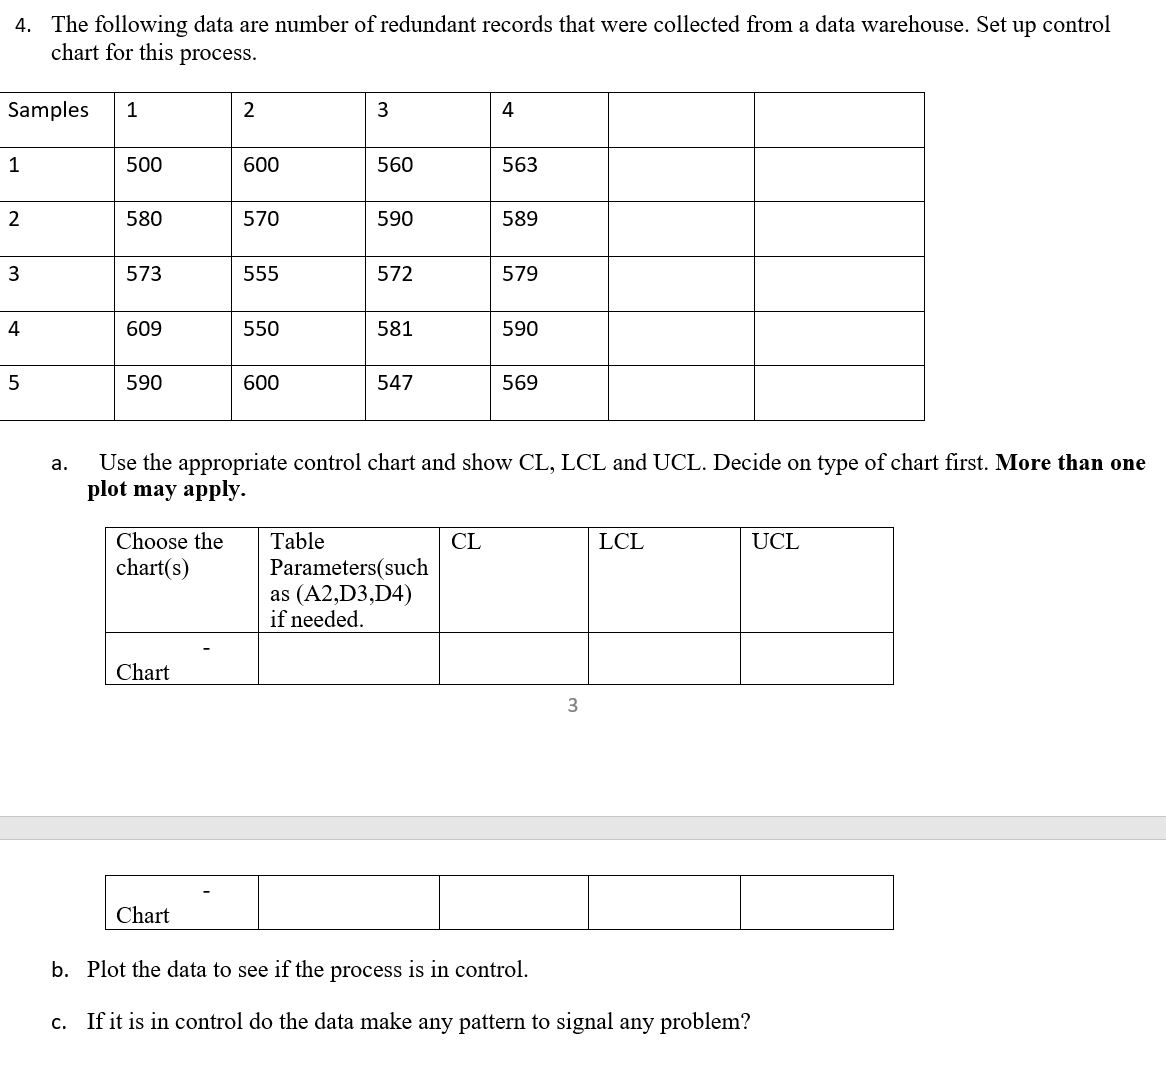
image text in transcribed
4. The following data are number of redundant records that were collected from a data warehouse. Set up control chart for this process. Samples 1 2 3 4 1 500 600 560 563 2 580 570 590 589 3 573 555 572 579 4 609 550 581 590 5 590 500 547 569 a. Use the appropriate control chart and show CL, LCL and UCL. Decide on type of chart rst. More than one plot may apply. Choose the Table CL LCL UCL chart(s) Parameters(such as (A2,D3,D4) if needed. Chart 3 Chart b. Plot the data to see if the process is in control. c. If it is in control do the data make any pattern to signal any

Step by Step Solution

There are 3 Steps involved in it

Step: 1

blur-text-image

Get Instant Access to Expert-Tailored Solutions

See step-by-step solutions with expert insights and AI powered tools for academic success

Step: 2

blur-text-image

Step: 3

blur-text-image

Ace Your Homework with AI

Get the answers you need in no time with our AI-driven, step-by-step assistance

Get Started

Recommended Textbook for

Algebra And Trigonometry, Enhanced

Authors: Cynthia Y Young

4th Edition

1119320860, 9781119320869

More Books

Students also viewed these Mathematics questions

Question

2. Develop a persuasive topic and thesis

Answered: 1 week ago

Question

1. Define the goals of persuasive speaking

Answered: 1 week ago