need help solving for operating metrics:
a. medicare revenue percentage
b. all-payer case mix index
c. labor hours per visit
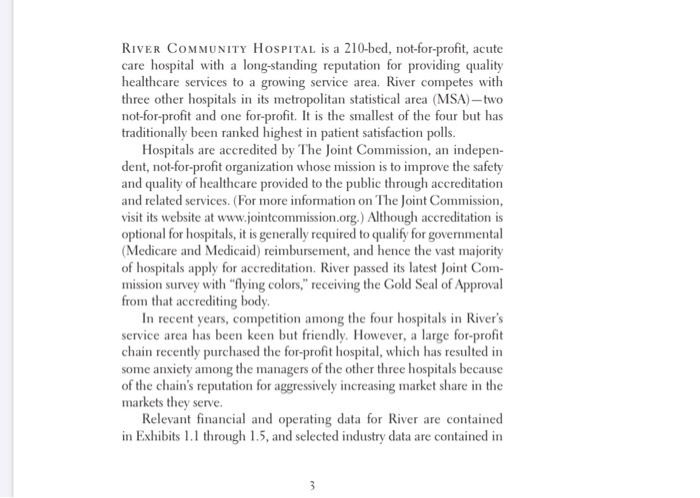
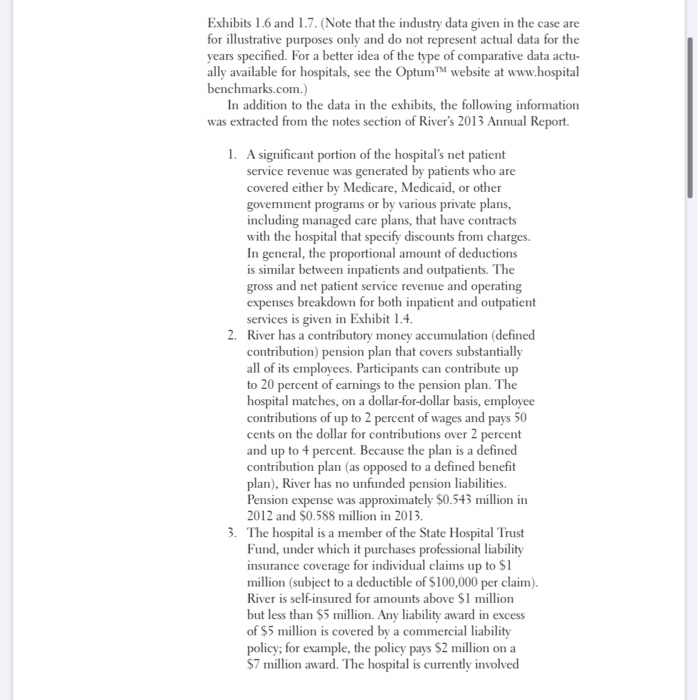
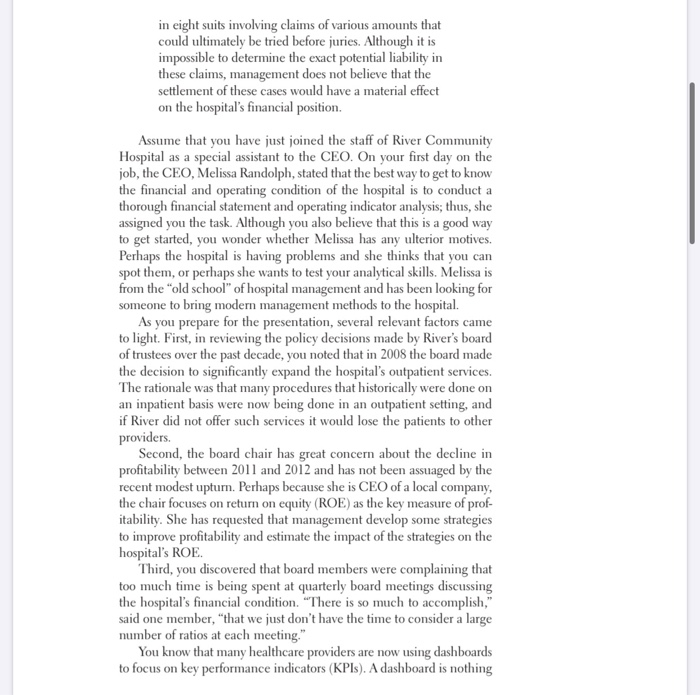
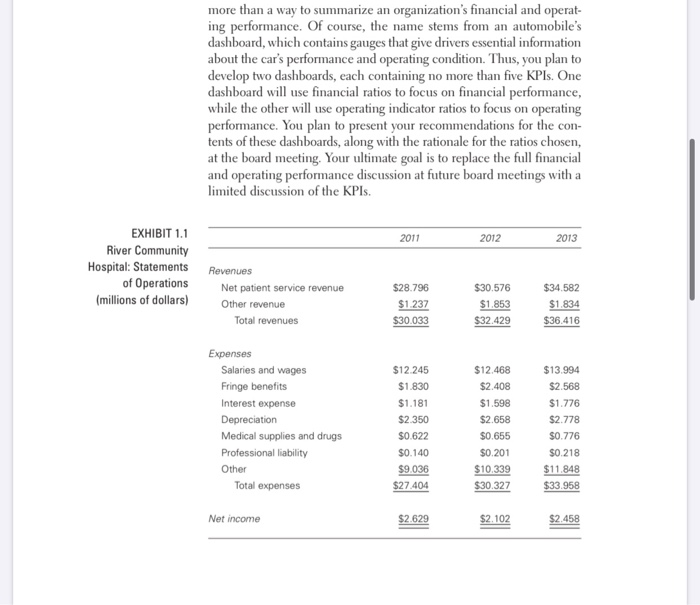
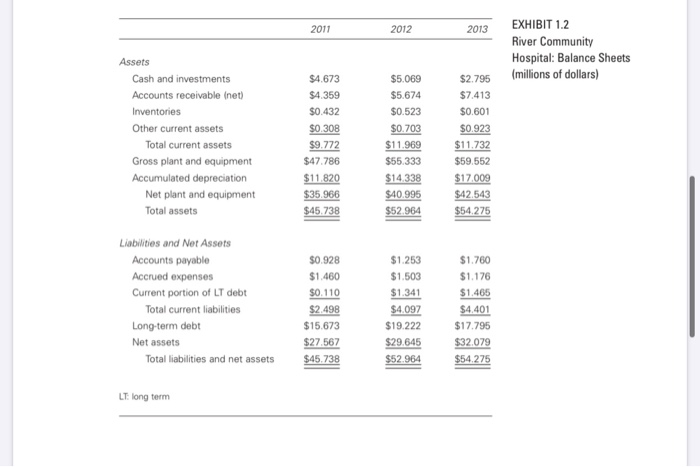
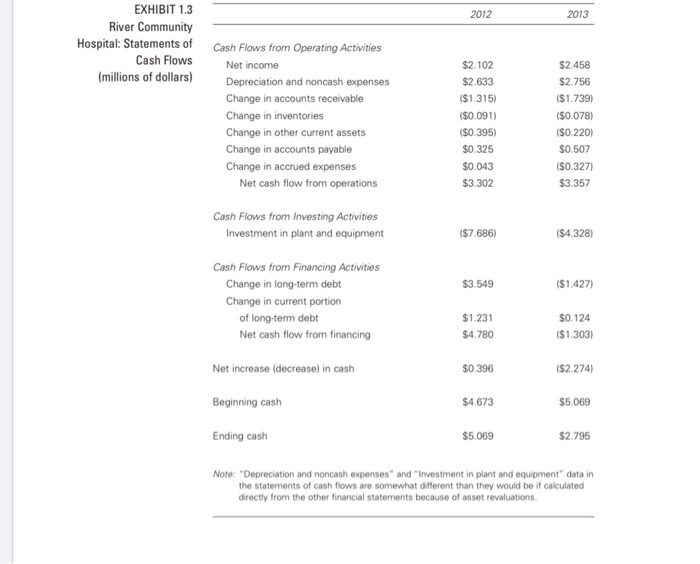
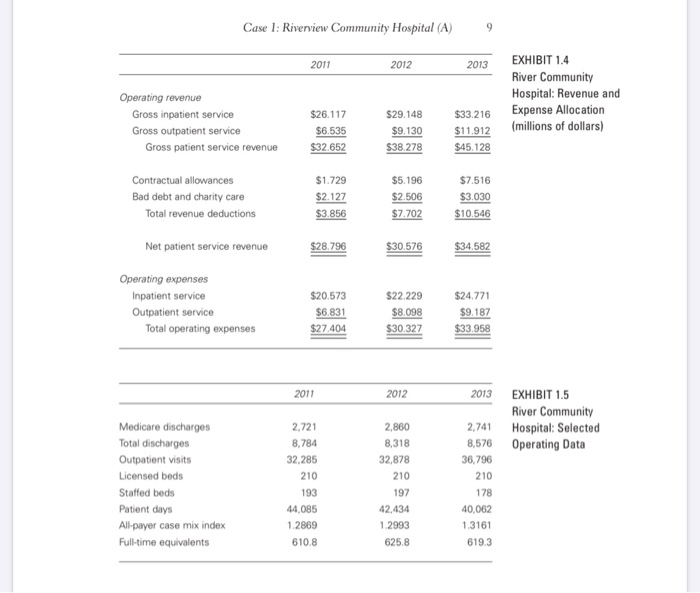
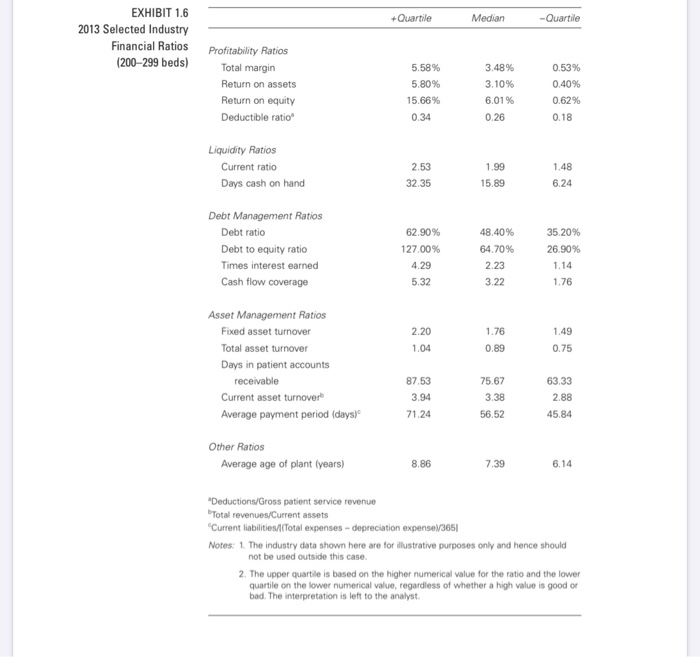
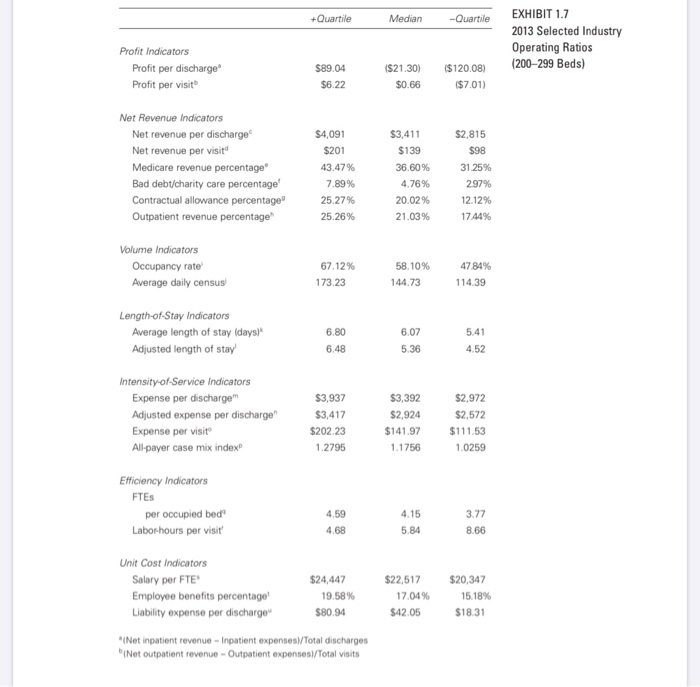
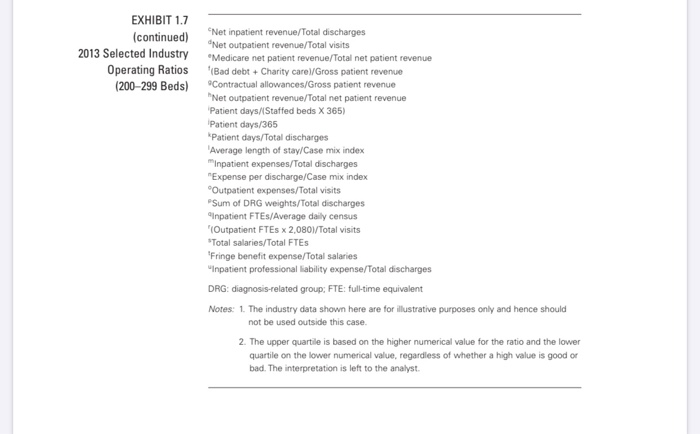
RIVER COMMUNITY HOSPITAL is a 210-bed, not-for-profit, acute care hospital with a long-standing reputation for providing quality healthcare services to a growing service area. River competes with three other hospitals in its metropolitan statistical area (MSA) - two not-for-profit and one for-profit. It is the smallest of the four but has traditionally been ranked highest in patient satisfaction polls. Hospitals are accredited by The Joint Commission, an indepen- dent, not-for-profit organization whose mission is to improve the safety and quality of healthcare provided to the public through accreditation and related services. (For more information on The Joint Commission, visit its website at www.jointcommission.org.) Although accreditation is optional for hospitals, it is generally required to qualify for governmental (Medicare and Medicaid) reimbursement, and hence the vast majority of hospitals apply for accreditation. River passed its latest Joint Com- mission survey with "flying colors," receiving the Gold Seal of Approval from that accrediting body. In recent years, competition among the four hospitals in River's service area has been keen but friendly. However, a large for-profit chain recently purchased the for-profit hospital, which has resulted in some anxiety among the managers of the other three hospitals because of the chain's reputation for aggressively increasing market share in the markets they serve. Relevant financial and operating data for River are contained in Exhibits 1.1 through 1.5, and selected industry data are contained in Exhibits 1.6 and 1.7. (Note that the industry data given in the case are for illustrative purposes only and do not represent actual data for the years specified. For a better idea of the type of comparative data actu- ally available for hospitals, see the Optum website at www.hospital benchmarks.com.) In addition to the data in the exhibits, the following information was extracted from the notes section of River's 2013 Annual Report. 1. A significant portion of the hospital's net patient service revenue was generated by patients who are covered either by Medicare, Medicaid, or other government programs or by various private plans, including managed care plans, that have contracts with the hospital that specify discounts from charges. In general, the proportional amount of deductions is similar between inpatients and outpatients. The gross and net patient service revenue and operating expenses breakdown for both inpatient and outpatient services is given in Exhibit 1.4. 2. River has a contributory money accumulation (defined contribution) pension plan that covers substantially all of its employees. Participants can contribute up to 20 percent of earnings to the pension plan. The hospital matches, on a dollar-for-dollar basis, employee contributions of up to 2 percent of wages and pays 50 cents on the dollar for contributions over 2 percent and up to 4 percent. Because the plan is a defined contribution plan (as opposed to a defined benefit plan), River has no unfunded pension liabilities. Pension expense was approximately $0.543 million in 2012 and $0.588 million in 2013. 3. The hospital is a member of the State Hospital Trust Fund, under which it purchases professional liability insurance coverage for individual claims up to $1 million (subject to a deductible of $100,000 per claim). River is self-insured for amounts above $1 million but less than $5 million. Any liability award in excess of $5 million is covered by a commercial liability policy; for example, the policy pays $2 million on a $7 million award. The hospital is currently involved in eight suits involving claims of various amounts that could ultimately be tried before juries. Although it is impossible to determine the exact potential liability in these claims, management does not believe that the settlement of these cases would have a material effect on the hospital's financial position. Assume that you have just joined the staff of River Community Hospital as a special assistant to the CEO. On your first day on the job, the CEO, Melissa Randolph, stated that the best way to get to know the financial and operating condition of the hospital is to conduct a thorough financial statement and operating indicator analysis; thus, she assigned you the task. Although you also believe that this is a good way to get started, you wonder whether Melissa has any ulterior motives, Perhaps the hospital is having problems and she thinks that you can spot them, or perhaps she wants to test your analytical skills. Melissa is from the "old school" of hospital management and has been looking for someone to bring modern management methods to the hospital. As you prepare for the presentation, several relevant factors came to light. First, in reviewing the policy decisions made by River's board of trustees over the past decade, you noted that in 2008 the board made the decision to significantly expand the hospital's outpatient services. The rationale was that many procedures that historically were done on an inpatient basis were now being done in an outpatient setting, and if River did not offer such services it would lose the patients to other providers. Second, the board chair has great concern about the decline in profitability between 2011 and 2012 and has not been assuaged by the recent modest upturn. Perhaps because she is CEO of a local company, the chair focuses on return on equity (ROE) as the key measure of prof- itability. She has requested that management develop some strategies to improve profitability and estimate the impact of the strategies on the hospital's ROE. Third, you discovered that board members were complaining that too much time is being spent at quarterly board meetings discussing the hospital's financial condition. "There is so much to accomplish," said one member, that we just don't have the time to consider a large number of ratios at each meeting." You know that many healthcare providers are now using dashboards to focus on key performance indicators (KPIs). A dashboard is nothing more than a way to summarize an organization's financial and operat- ing performance. Of course, the name stems from an automobile's dashboard, which contains gauges that give drivers essential information about the car's performance and operating condition. Thus, you plan to develop two dashboards, each containing no more than five KPIs. One dashboard will use financial ratios to focus on financial performance, while the other will use operating indicator ratios to focus on operating performance. You plan to present your recommendations for the con- tents of these dashboards, along with the rationale for the ratios chosen, at the board meeting. Your ultimate goal is to replace the full financial and operating performance discussion at future board meetings with a limited discussion of the KPIs. 2011 2012 2013 EXHIBIT 1.1 River Community Hospital: Statements of Operations (millions of dollars) Revenues Net patient service revenue Other revenue Total revenues $28.796 $1.237 $30.033 $30.576 $1.853 $32.429 $34.582 $1.834 $36.416 Expenses Salaries and wages Fringe benefits Interest expense Depreciation Medical supplies and drugs Professional liability Other Total expenses $12.245 $1.830 $1.181 $2.350 $0.622 $0.140 $9.036 $27.404 $12.468 $2.408 $1.598 $2.658 $0.655 $0.201 $10.339 $30.327 $13.994 $2.568 $1.776 $2.778 $0.776 $0.218 $11.848 $33.958 Net income $2.629 $2.102 $2.458 2011 2012 2013 EXHIBIT 1.2 River Community Hospital: Balance Sheets (millions of dollars) $2.795 Assets Cash and investments Accounts receivable Inet) Inventories Other current assets Total current assets Gross plant and equipment Accumulated depreciation Net plant and equipment Total assets $4.673 $4.359 $0.432 $0.308 $9.772 $47.786 $11.820 $35.966 $45.738 $5.069 $5.674 $0.523 $0.703 $11.969 $55.333 $14.338 $40.995 $52.964 $7.413 $0.601 $0.923 $11.732 $59.552 $17.009 $42.543 $54.275 Liabilities and Net Assets Accounts payable Accrued expenses Current portion of LT debt Total current liabilities Long-term debt Net assets Total liabilities and net assets $0.928 $1.460 $0.110 $2.498 $15.673 $27.567 $45.738 $1.253 $1.503 $1.341 $4.097 $19.222 $29.645 $52.964 $1.760 $1.176 $1.465 $4.401 $17.795 $32.079 $54.275 LT long term 2012 2013 EXHIBIT 1.3 River Community Hospital: Statements of Cash Flows (millions of dollars) Cash Flows from Operating Activities Net income Depreciation and noncash expenses Change in accounts receivable Change in inventories Change in other current assets Change in accounts payable Change in accrued expenses Net cash flow from operations $2.102 $2.633 ($1.315) ($0.091) ($0.395) $0.325 $0.043 $3.302 $2.458 $2.756 ($1.739) ($0.078) ($0.220) $0.507 ($0.327) $3.357 Cash Flows from Investing Activities Investment in plant and equipment ($7.686) ($4.328) $3.549 ($1.427) Cash Flows from Financing Activities Change in long-term debt Change in current portion of long-term debt Net cash flow from financing $1.231 $4.780 $0.124 ($1.303) Net increase (decrease) in cash $0.396 ($2.274) Beginning cash $4.673 $5.069 Ending cash $5.069 $2.795 Note: "Depreciation and noncash expenses" and Investment in plant and equipment" data in the statements of cash flows are somewhat different than they would be if calculated directly from the other financial statements because of asset revaluations Case 1: Riverview Community Hospital (A) 9 2011 2012 2013 Operating revenue Gross inpatient service Gross outpatient service Gross patient service revenue EXHIBIT 1.4 River Community Hospital: Revenue and Expense Allocation (millions of dollars) $26.117 $6.535 $32.652 $29.148 $9.130 $38.278 $33.216 $11.912 $45.128 Contractual allowances Bad debt and charity care Total revenue deductions $1.729 $2.127 $3.856 $5.196 $2.506 $7.702 $7.516 $3.030 $10.546 Net patient service revenue $28.796 $30,576 $34.582 Operating expenses Inpatient service Outpatient service Total operating expenses $20.573 $6.831 $27.404 $22.229 $8.098 $30.327 $24.771 $9.187 $33.958 2011 2012 2013 EXHIBIT 1.5 River Community Hospital: Selected Operating Data Medicare discharges Total discharges Outpatient visits Licensed beds Staffed beds Patient days All payer case mix index Full-time equivalents 2,721 8,784 32,285 210 193 44,085 1.2869 610.8 2,860 8,318 32,878 210 197 42,434 1.2993 625.8 2,741 8,576 36,796 210 178 40,062 1.3161 619.3 +Quartile Median -Quartile EXHIBIT 1.6 2013 Selected Industry Financial Ratios (200-299 beds) Profitability Ratios Total margin Return on assets Return on equity Deductible ratio 5.58% 5.80% 15.66% 0.34 3.48% 3.10% 6.01% 0.26 0.53% 0.40% 0.62% 0.18 Liquidity Ratios Current ratio Days cash on hand 2.53 32.35 1.99 15.89 1.48 6.24 Debt Management Ratios Debt ratio Debt to equity ratio Times interest earned Cash flow coverage 62.90% 127.00% 4.29 5.32 48.40% 64.70% 2.23 3.22 35.20% 26.90% 1.14 1.76 1.49 0.75 1.04 Asset Management Ratios Fixed asset turnover Total asset turnover Days in patient accounts receivable Current asset turnover Average payment period (days) 87.53 3.94 63.33 2.88 45.84 71.24 Other Ratios Average age of plant (years) 8.86 7.39 6.14 "Deductions/Gross patient service revenue Total revenues/Current assets "Current liabilities/Total expenses-depreciation expense 365 Notes: 1. The industry data shown here are for illustrative purposes only and hence should not be used outside this case 2. The upper quartile is based on the higher numerical value for the ratio and the lower quartile on the lower numerical value, regardless of whether a high value is good or bad. The interpretation is left to the analyst. +Quartile Median Quartile EXHIBIT 1.7 2013 Selected Industry Operating Ratios (200-299 Beds) Profit Indicators Profit per discharge Profit per visit $89.04 $6.22 $21.30) $0.66 ($120.08) $7.01) Net Revenue Indicators Net revenue per discharge Net revenue per visit Medicare revenue percentage Bad debt/charity care percentage Contractual allowance percentage Outpatient revenue percentage $4,091 $201 43.47% 7.89% 25.27% 25.26% $3,411 $139 36.60% 4.76% 20.02% 21.03% $2,815 $98 31.25% 297% 12.12% 1744% Volume Indicators Occupancy rate Average daily census 67.12% 173.23 58.10% 144.73 4784% 114.39 Length-of-Stay Indicators Average length of stay days) Adjusted length of stay 6.80 6.48 6.07 5.36 5.41 4.52 Intensity-of-Service Indicators Expense per discharge Adjusted expense per discharge Expense per visit All payer case mix index $3,937 $3,417 $202.23 1.2795 $3,392 $2,924 $141.97 1.1756 $2.972 $2,572 $111.53 1.0259 Efficiency Indicators FTES per occupied bed Labor hours per visit 4.59 4.68 4.15 5.84 3.77 8.66 Unit Cost Indicators Salary per FTE Employee benefits percentage! Liability expense per discharge $24,447 19.58% $80.94 $22,517 17.04% $42.05 $20,347 15.18% $18.31 "Net inpatient revenue - Inpatient expenses/Total discharges iNet outpatient revenue - Outpatient expenses/Total Visits EXHIBIT 1.7 (continued) 2013 Selected Industry Operating Ratios (200-299 Beds) Net inpatient revenue/Total discharges Net outpatient revenue/Total visits Medicare net patient revenue/Total net patient revenue (Bad debt + Charity carel/Gross patient revenue Contractual allowances/Gross patient revenue "Net outpatient revenue/Total net patient revenue Patient days/Staffed beds X 365) Patient days/365 Patient days/Total discharges Average length of stay/Case mix index Inpatient expenses/Total discharges "Expense per discharge/Case mix index Outpatient expenses/Total Visits Sum of DRG weights/Total discharges Inpatient FTES/Average daily census (Outpatient FTES x 2,0801/Total Visits *Total salaries/Total FTES 'Fringe benefit expense/Total salaries Inpatient professional liability expense/Total discharges DRG: diagnosis-related group: FTE: full-time equivalent Notes: 1. The industry data shown here are for illustrative purposes only and hence should not be used outside this case. 2. The upper quartile is based on the higher numerical value for the ratio and the lower quartile on the lower numerical value, regardless of whether a high value is good or bad. The interpretation is left to the analyst. RIVER COMMUNITY HOSPITAL is a 210-bed, not-for-profit, acute care hospital with a long-standing reputation for providing quality healthcare services to a growing service area. River competes with three other hospitals in its metropolitan statistical area (MSA) - two not-for-profit and one for-profit. It is the smallest of the four but has traditionally been ranked highest in patient satisfaction polls. Hospitals are accredited by The Joint Commission, an indepen- dent, not-for-profit organization whose mission is to improve the safety and quality of healthcare provided to the public through accreditation and related services. (For more information on The Joint Commission, visit its website at www.jointcommission.org.) Although accreditation is optional for hospitals, it is generally required to qualify for governmental (Medicare and Medicaid) reimbursement, and hence the vast majority of hospitals apply for accreditation. River passed its latest Joint Com- mission survey with "flying colors," receiving the Gold Seal of Approval from that accrediting body. In recent years, competition among the four hospitals in River's service area has been keen but friendly. However, a large for-profit chain recently purchased the for-profit hospital, which has resulted in some anxiety among the managers of the other three hospitals because of the chain's reputation for aggressively increasing market share in the markets they serve. Relevant financial and operating data for River are contained in Exhibits 1.1 through 1.5, and selected industry data are contained in Exhibits 1.6 and 1.7. (Note that the industry data given in the case are for illustrative purposes only and do not represent actual data for the years specified. For a better idea of the type of comparative data actu- ally available for hospitals, see the Optum website at www.hospital benchmarks.com.) In addition to the data in the exhibits, the following information was extracted from the notes section of River's 2013 Annual Report. 1. A significant portion of the hospital's net patient service revenue was generated by patients who are covered either by Medicare, Medicaid, or other government programs or by various private plans, including managed care plans, that have contracts with the hospital that specify discounts from charges. In general, the proportional amount of deductions is similar between inpatients and outpatients. The gross and net patient service revenue and operating expenses breakdown for both inpatient and outpatient services is given in Exhibit 1.4. 2. River has a contributory money accumulation (defined contribution) pension plan that covers substantially all of its employees. Participants can contribute up to 20 percent of earnings to the pension plan. The hospital matches, on a dollar-for-dollar basis, employee contributions of up to 2 percent of wages and pays 50 cents on the dollar for contributions over 2 percent and up to 4 percent. Because the plan is a defined contribution plan (as opposed to a defined benefit plan), River has no unfunded pension liabilities. Pension expense was approximately $0.543 million in 2012 and $0.588 million in 2013. 3. The hospital is a member of the State Hospital Trust Fund, under which it purchases professional liability insurance coverage for individual claims up to $1 million (subject to a deductible of $100,000 per claim). River is self-insured for amounts above $1 million but less than $5 million. Any liability award in excess of $5 million is covered by a commercial liability policy; for example, the policy pays $2 million on a $7 million award. The hospital is currently involved in eight suits involving claims of various amounts that could ultimately be tried before juries. Although it is impossible to determine the exact potential liability in these claims, management does not believe that the settlement of these cases would have a material effect on the hospital's financial position. Assume that you have just joined the staff of River Community Hospital as a special assistant to the CEO. On your first day on the job, the CEO, Melissa Randolph, stated that the best way to get to know the financial and operating condition of the hospital is to conduct a thorough financial statement and operating indicator analysis; thus, she assigned you the task. Although you also believe that this is a good way to get started, you wonder whether Melissa has any ulterior motives, Perhaps the hospital is having problems and she thinks that you can spot them, or perhaps she wants to test your analytical skills. Melissa is from the "old school" of hospital management and has been looking for someone to bring modern management methods to the hospital. As you prepare for the presentation, several relevant factors came to light. First, in reviewing the policy decisions made by River's board of trustees over the past decade, you noted that in 2008 the board made the decision to significantly expand the hospital's outpatient services. The rationale was that many procedures that historically were done on an inpatient basis were now being done in an outpatient setting, and if River did not offer such services it would lose the patients to other providers. Second, the board chair has great concern about the decline in profitability between 2011 and 2012 and has not been assuaged by the recent modest upturn. Perhaps because she is CEO of a local company, the chair focuses on return on equity (ROE) as the key measure of prof- itability. She has requested that management develop some strategies to improve profitability and estimate the impact of the strategies on the hospital's ROE. Third, you discovered that board members were complaining that too much time is being spent at quarterly board meetings discussing the hospital's financial condition. "There is so much to accomplish," said one member, that we just don't have the time to consider a large number of ratios at each meeting." You know that many healthcare providers are now using dashboards to focus on key performance indicators (KPIs). A dashboard is nothing more than a way to summarize an organization's financial and operat- ing performance. Of course, the name stems from an automobile's dashboard, which contains gauges that give drivers essential information about the car's performance and operating condition. Thus, you plan to develop two dashboards, each containing no more than five KPIs. One dashboard will use financial ratios to focus on financial performance, while the other will use operating indicator ratios to focus on operating performance. You plan to present your recommendations for the con- tents of these dashboards, along with the rationale for the ratios chosen, at the board meeting. Your ultimate goal is to replace the full financial and operating performance discussion at future board meetings with a limited discussion of the KPIs. 2011 2012 2013 EXHIBIT 1.1 River Community Hospital: Statements of Operations (millions of dollars) Revenues Net patient service revenue Other revenue Total revenues $28.796 $1.237 $30.033 $30.576 $1.853 $32.429 $34.582 $1.834 $36.416 Expenses Salaries and wages Fringe benefits Interest expense Depreciation Medical supplies and drugs Professional liability Other Total expenses $12.245 $1.830 $1.181 $2.350 $0.622 $0.140 $9.036 $27.404 $12.468 $2.408 $1.598 $2.658 $0.655 $0.201 $10.339 $30.327 $13.994 $2.568 $1.776 $2.778 $0.776 $0.218 $11.848 $33.958 Net income $2.629 $2.102 $2.458 2011 2012 2013 EXHIBIT 1.2 River Community Hospital: Balance Sheets (millions of dollars) $2.795 Assets Cash and investments Accounts receivable Inet) Inventories Other current assets Total current assets Gross plant and equipment Accumulated depreciation Net plant and equipment Total assets $4.673 $4.359 $0.432 $0.308 $9.772 $47.786 $11.820 $35.966 $45.738 $5.069 $5.674 $0.523 $0.703 $11.969 $55.333 $14.338 $40.995 $52.964 $7.413 $0.601 $0.923 $11.732 $59.552 $17.009 $42.543 $54.275 Liabilities and Net Assets Accounts payable Accrued expenses Current portion of LT debt Total current liabilities Long-term debt Net assets Total liabilities and net assets $0.928 $1.460 $0.110 $2.498 $15.673 $27.567 $45.738 $1.253 $1.503 $1.341 $4.097 $19.222 $29.645 $52.964 $1.760 $1.176 $1.465 $4.401 $17.795 $32.079 $54.275 LT long term 2012 2013 EXHIBIT 1.3 River Community Hospital: Statements of Cash Flows (millions of dollars) Cash Flows from Operating Activities Net income Depreciation and noncash expenses Change in accounts receivable Change in inventories Change in other current assets Change in accounts payable Change in accrued expenses Net cash flow from operations $2.102 $2.633 ($1.315) ($0.091) ($0.395) $0.325 $0.043 $3.302 $2.458 $2.756 ($1.739) ($0.078) ($0.220) $0.507 ($0.327) $3.357 Cash Flows from Investing Activities Investment in plant and equipment ($7.686) ($4.328) $3.549 ($1.427) Cash Flows from Financing Activities Change in long-term debt Change in current portion of long-term debt Net cash flow from financing $1.231 $4.780 $0.124 ($1.303) Net increase (decrease) in cash $0.396 ($2.274) Beginning cash $4.673 $5.069 Ending cash $5.069 $2.795 Note: "Depreciation and noncash expenses" and Investment in plant and equipment" data in the statements of cash flows are somewhat different than they would be if calculated directly from the other financial statements because of asset revaluations Case 1: Riverview Community Hospital (A) 9 2011 2012 2013 Operating revenue Gross inpatient service Gross outpatient service Gross patient service revenue EXHIBIT 1.4 River Community Hospital: Revenue and Expense Allocation (millions of dollars) $26.117 $6.535 $32.652 $29.148 $9.130 $38.278 $33.216 $11.912 $45.128 Contractual allowances Bad debt and charity care Total revenue deductions $1.729 $2.127 $3.856 $5.196 $2.506 $7.702 $7.516 $3.030 $10.546 Net patient service revenue $28.796 $30,576 $34.582 Operating expenses Inpatient service Outpatient service Total operating expenses $20.573 $6.831 $27.404 $22.229 $8.098 $30.327 $24.771 $9.187 $33.958 2011 2012 2013 EXHIBIT 1.5 River Community Hospital: Selected Operating Data Medicare discharges Total discharges Outpatient visits Licensed beds Staffed beds Patient days All payer case mix index Full-time equivalents 2,721 8,784 32,285 210 193 44,085 1.2869 610.8 2,860 8,318 32,878 210 197 42,434 1.2993 625.8 2,741 8,576 36,796 210 178 40,062 1.3161 619.3 +Quartile Median -Quartile EXHIBIT 1.6 2013 Selected Industry Financial Ratios (200-299 beds) Profitability Ratios Total margin Return on assets Return on equity Deductible ratio 5.58% 5.80% 15.66% 0.34 3.48% 3.10% 6.01% 0.26 0.53% 0.40% 0.62% 0.18 Liquidity Ratios Current ratio Days cash on hand 2.53 32.35 1.99 15.89 1.48 6.24 Debt Management Ratios Debt ratio Debt to equity ratio Times interest earned Cash flow coverage 62.90% 127.00% 4.29 5.32 48.40% 64.70% 2.23 3.22 35.20% 26.90% 1.14 1.76 1.49 0.75 1.04 Asset Management Ratios Fixed asset turnover Total asset turnover Days in patient accounts receivable Current asset turnover Average payment period (days) 87.53 3.94 63.33 2.88 45.84 71.24 Other Ratios Average age of plant (years) 8.86 7.39 6.14 "Deductions/Gross patient service revenue Total revenues/Current assets "Current liabilities/Total expenses-depreciation expense 365 Notes: 1. The industry data shown here are for illustrative purposes only and hence should not be used outside this case 2. The upper quartile is based on the higher numerical value for the ratio and the lower quartile on the lower numerical value, regardless of whether a high value is good or bad. The interpretation is left to the analyst. +Quartile Median Quartile EXHIBIT 1.7 2013 Selected Industry Operating Ratios (200-299 Beds) Profit Indicators Profit per discharge Profit per visit $89.04 $6.22 $21.30) $0.66 ($120.08) $7.01) Net Revenue Indicators Net revenue per discharge Net revenue per visit Medicare revenue percentage Bad debt/charity care percentage Contractual allowance percentage Outpatient revenue percentage $4,091 $201 43.47% 7.89% 25.27% 25.26% $3,411 $139 36.60% 4.76% 20.02% 21.03% $2,815 $98 31.25% 297% 12.12% 1744% Volume Indicators Occupancy rate Average daily census 67.12% 173.23 58.10% 144.73 4784% 114.39 Length-of-Stay Indicators Average length of stay days) Adjusted length of stay 6.80 6.48 6.07 5.36 5.41 4.52 Intensity-of-Service Indicators Expense per discharge Adjusted expense per discharge Expense per visit All payer case mix index $3,937 $3,417 $202.23 1.2795 $3,392 $2,924 $141.97 1.1756 $2.972 $2,572 $111.53 1.0259 Efficiency Indicators FTES per occupied bed Labor hours per visit 4.59 4.68 4.15 5.84 3.77 8.66 Unit Cost Indicators Salary per FTE Employee benefits percentage! Liability expense per discharge $24,447 19.58% $80.94 $22,517 17.04% $42.05 $20,347 15.18% $18.31 "Net inpatient revenue - Inpatient expenses/Total discharges iNet outpatient revenue - Outpatient expenses/Total Visits EXHIBIT 1.7 (continued) 2013 Selected Industry Operating Ratios (200-299 Beds) Net inpatient revenue/Total discharges Net outpatient revenue/Total visits Medicare net patient revenue/Total net patient revenue (Bad debt + Charity carel/Gross patient revenue Contractual allowances/Gross patient revenue "Net outpatient revenue/Total net patient revenue Patient days/Staffed beds X 365) Patient days/365 Patient days/Total discharges Average length of stay/Case mix index Inpatient expenses/Total discharges "Expense per discharge/Case mix index Outpatient expenses/Total Visits Sum of DRG weights/Total discharges Inpatient FTES/Average daily census (Outpatient FTES x 2,0801/Total Visits *Total salaries/Total FTES 'Fringe benefit expense/Total salaries Inpatient professional liability expense/Total discharges DRG: diagnosis-related group: FTE: full-time equivalent Notes: 1. The industry data shown here are for illustrative purposes only and hence should not be used outside this case. 2. The upper quartile is based on the higher numerical value for the ratio and the lower quartile on the lower numerical value, regardless of whether a high value is good or bad. The interpretation is left to the analyst