Answered step by step
Verified Expert Solution
Question
1 Approved Answer
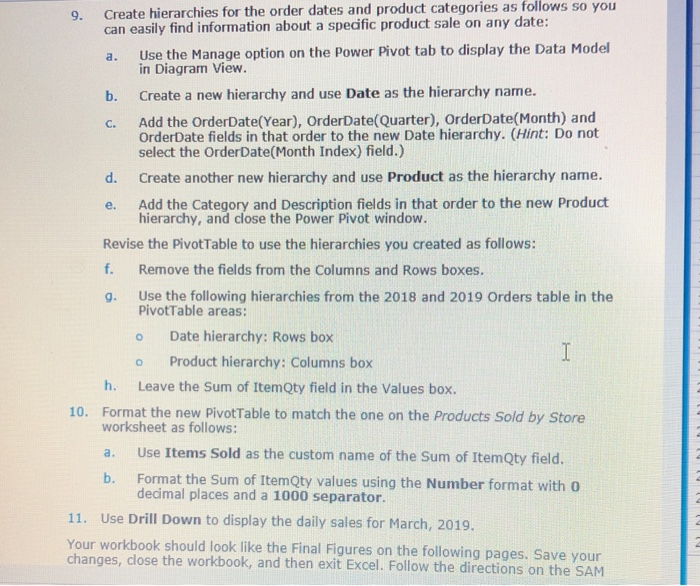
Need help with 9F- 11 9. a. C. e. Create hierarchies for the order dates and product categories as follows so you can easily find


Need help with 9F- 11
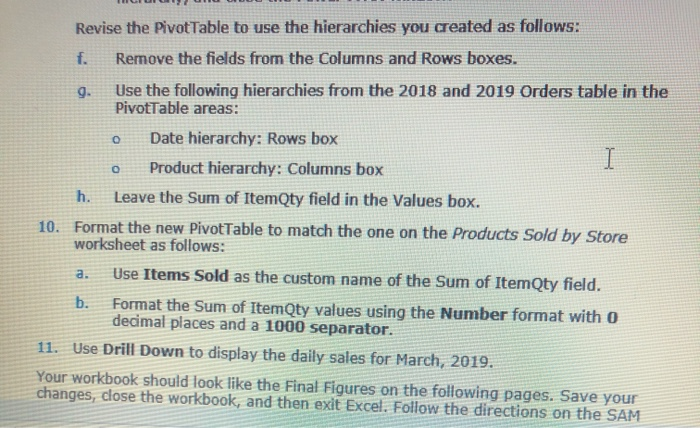
9. a. C. e. Create hierarchies for the order dates and product categories as follows so you can easily find information about a specific product sale on any date: Use the Manage option on the Power Pivot tab to display the Data Model in Diagram View. b. Create a new hierarchy and use Date as the hierarchy name. Add the OrderDate(Year), OrderDate(Quarter), OrderDate(Month) and OrderDate fields in that order to the new Date hierarchy. (Hint: Do not select the Order Date(Month Index) field.) d. Create another new hierarchy and use Product as the hierarchy name. Add the Category and Description fields in that order to the new Product hierarchy, and close the Power Pivot window. Revise the PivotTable to use the hierarchies you created as follows: f. Remove the fields from the Columns and Rows boxes. g. Use the following hierarchies from the 2018 and 2019 Orders table in the PivotTable areas: Date hierarchy: Rows box Product hierarchy: Columns box h. Leave the Sum of ItemQty field in the Values box. 10. Format the new PivotTable to match the one on the Products Sold by Store worksheet as follows: O I Use Items Sold as the custom name of the Sum of ItemQty field. b. Format the Sum of ItemQty values using the Number format with o decimal places and a 1000 separator. 11. Use Drill Down to display the daily sales for March, 2019. Your workbook should look like the Final Figures on the following pages. Save your changes, close the workbook, and then exit Excel. Follow the directions on the SAM Revise the Pivot Table to use the hierarchies you created as follows: f. Remove the fields from the Columns and Rows boxes. 0 9. Use the following hierarchies from the 2018 and 2019 Orders table in the PivotTable areas: Date hierarchy: Rows box Product hierarchy: Columns box h. Leave the Sum of ItemQty field in the Values box. 10. Format the new PivotTable to match the one on the Products Sold by Store worksheet as follows: I o a. Use Items Sold as the custom name of the Sum of ItemQty field. b. Format the Sum of ItemQty values using the Number format with O decimal places and a 1000 separator. 11. Use Drill Down to display the daily sales for March, 2019. Your workbook should look like the Final Figures on the following pages. Save your changes, close the workbook, and then exit Excel. Follow the directions on the SAM 9. a. C. e. Create hierarchies for the order dates and product categories as follows so you can easily find information about a specific product sale on any date: Use the Manage option on the Power Pivot tab to display the Data Model in Diagram View. b. Create a new hierarchy and use Date as the hierarchy name. Add the OrderDate(Year), OrderDate(Quarter), OrderDate(Month) and OrderDate fields in that order to the new Date hierarchy. (Hint: Do not select the Order Date(Month Index) field.) d. Create another new hierarchy and use Product as the hierarchy name. Add the Category and Description fields in that order to the new Product hierarchy, and close the Power Pivot window. Revise the PivotTable to use the hierarchies you created as follows: f. Remove the fields from the Columns and Rows boxes. g. Use the following hierarchies from the 2018 and 2019 Orders table in the PivotTable areas: Date hierarchy: Rows box Product hierarchy: Columns box h. Leave the Sum of ItemQty field in the Values box. 10. Format the new PivotTable to match the one on the Products Sold by Store worksheet as follows: O I Use Items Sold as the custom name of the Sum of ItemQty field. b. Format the Sum of ItemQty values using the Number format with o decimal places and a 1000 separator. 11. Use Drill Down to display the daily sales for March, 2019. Your workbook should look like the Final Figures on the following pages. Save your changes, close the workbook, and then exit Excel. Follow the directions on the SAM Revise the Pivot Table to use the hierarchies you created as follows: f. Remove the fields from the Columns and Rows boxes. 0 9. Use the following hierarchies from the 2018 and 2019 Orders table in the PivotTable areas: Date hierarchy: Rows box Product hierarchy: Columns box h. Leave the Sum of ItemQty field in the Values box. 10. Format the new PivotTable to match the one on the Products Sold by Store worksheet as follows: I o a. Use Items Sold as the custom name of the Sum of ItemQty field. b. Format the Sum of ItemQty values using the Number format with O decimal places and a 1000 separator. 11. Use Drill Down to display the daily sales for March, 2019. Your workbook should look like the Final Figures on the following pages. Save your changes, close the workbook, and then exit Excel. Follow the directions on the SAM Step by Step Solution
There are 3 Steps involved in it
Step: 1

Get Instant Access to Expert-Tailored Solutions
See step-by-step solutions with expert insights and AI powered tools for academic success
Step: 2

Step: 3

Ace Your Homework with AI
Get the answers you need in no time with our AI-driven, step-by-step assistance
Get Started


