Answered step by step
Verified Expert Solution
Link Copied!

Question

1 Approved Answer

Need help with my statistics project. I was thinking on doing on obesity in America but im having trouble finding statistical information. Chapter 1 Project:

Need help with my statistics project. I was thinking on doing on obesity in America but im having trouble finding statistical information.
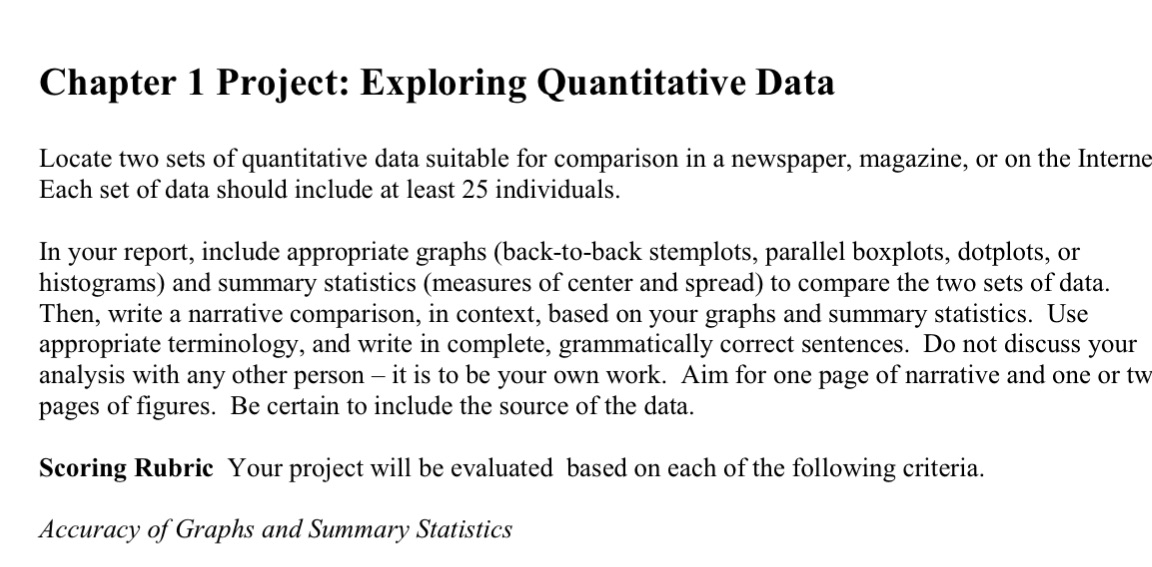
image text in transcribed
Chapter 1 Project: Exploring Quantitative Data Locate two sets of quantitative data suitable for comparison in a newspaper, magazine, or on the Interne Each set of data should include at least 25 individuals. In your report, include appropriate graphs (back-toback stemplots, parallel boxplots, dotplots, or histograms) and summary statistics (measures of center and spread) to compare the two sets of data. Then, write a narrative comparison, in context, based on your graphs and summary statistics. Use appropriate terminology, and write in complete, grammatically correct sentences. Do not discuss your analysis with any other person it is to be your own work. Aim for one page of narrative and one or tw pages of gures. Be certain to include the source of the data. Scoring Rubric Your project will be evaluated based on each of the following criteria. Accuracy of Graphs and Summary Statistics

Step by Step Solution

There are 3 Steps involved in it

Step: 1

blur-text-image

Get Instant Access to Expert-Tailored Solutions

See step-by-step solutions with expert insights and AI powered tools for academic success

Step: 2

blur-text-image

Step: 3

blur-text-image

Ace Your Homework with AI

Get the answers you need in no time with our AI-driven, step-by-step assistance

Get Started

Recommended Textbook for

An Introduction to Measure Theoretic Probability

Authors: George G. Roussas

2nd edition

128000422, 978-0128000427

More Books

Students also viewed these Mathematics questions