need help with question 2, please answer in python, thanks
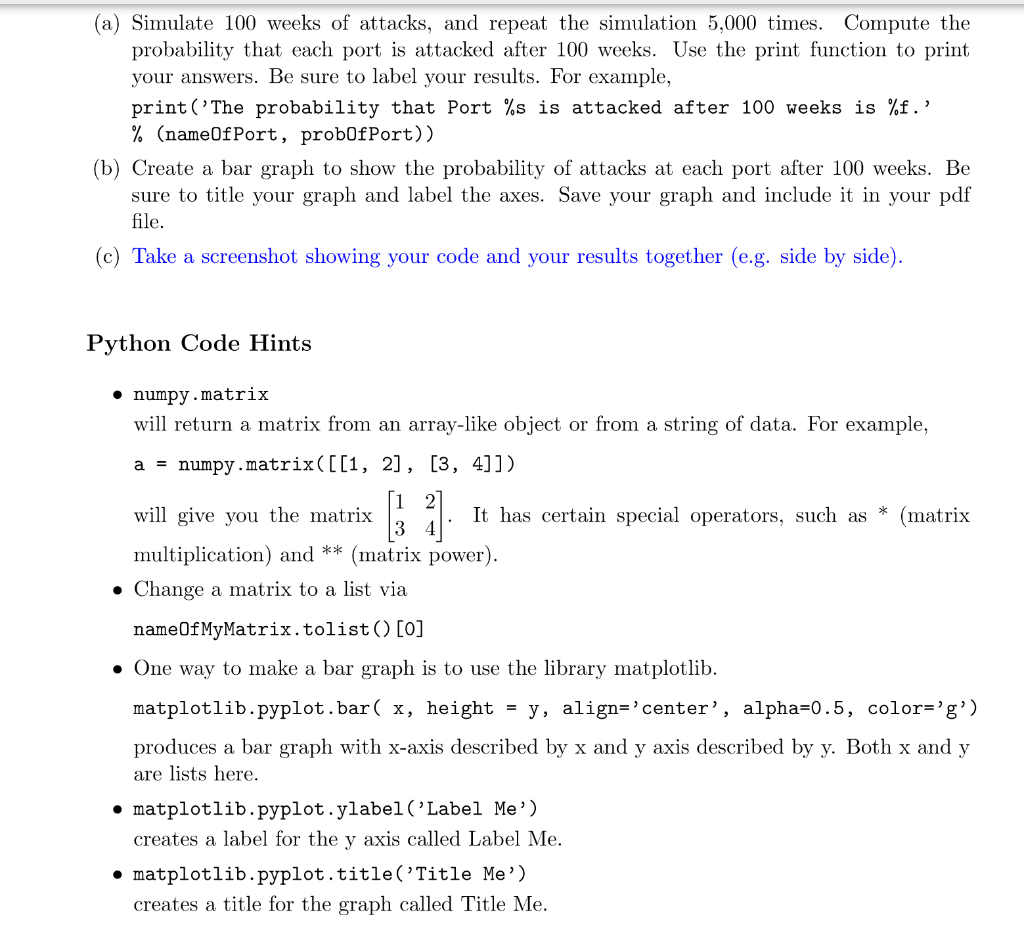
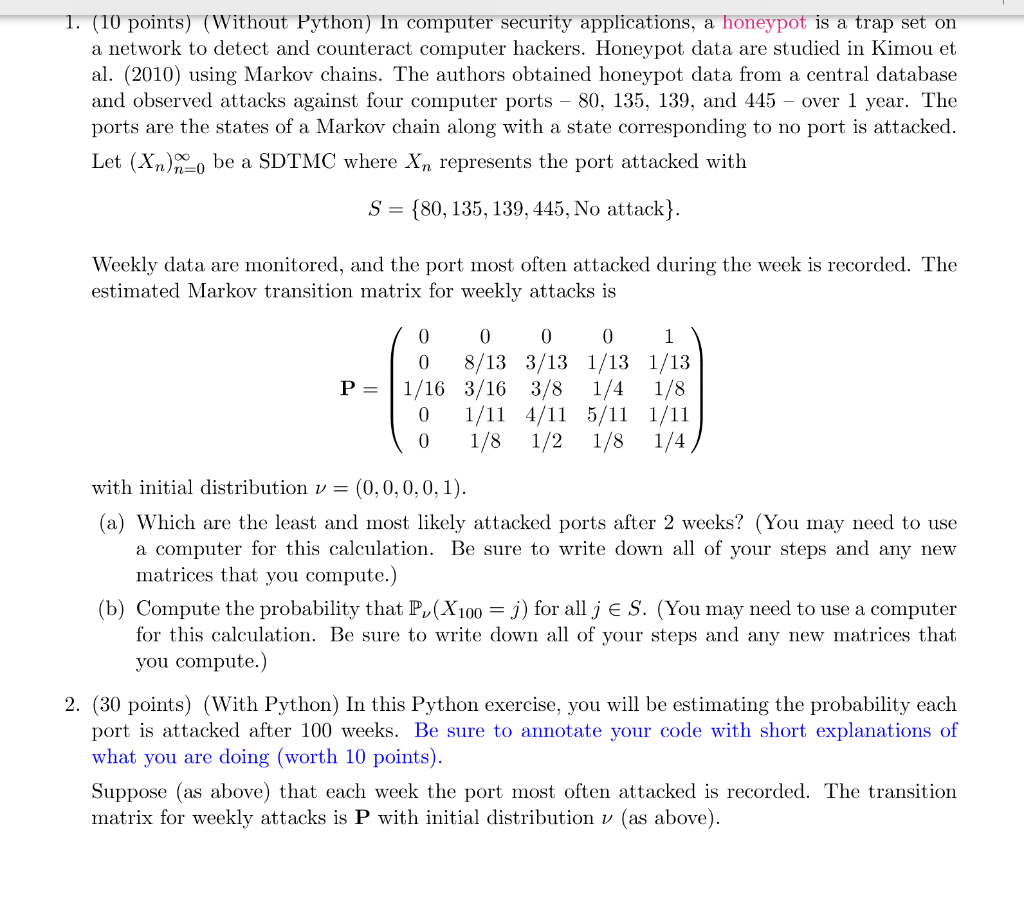
(a) Simulate 100 weeks of attacks, and repeat the simulation 5,000 times. Compute the probability that each port is attacked after 100 weeks. Use the print function to print your answers. Be sure to label your results. For example, print ("The probability that Port %s is attacked after 100 weeks is %f", % (nameOfPort , prob0fPort)) (b) Create a bar graph to show the probability of attacks at each port after 100 weeks. Be sure to title your graph and label the axes. Save your graph and include it in your pdf file. (c) Take a screenshot showing your code and your results together (e.g. side by side) Python Code Hints * numpy.matrix will return a matrix from an array-like object or from a string of data. For example, a - numpy.matrix([[1, 2], [3, 4]]) will give you the matrix multiplication) and ** (matrix power). It has certain special operators, such as * (matrix . Change a matrix to a list via nameOfMyMatrix.tolist() [0] One way to make a bar graph is to use the library matplotlib. matplotlib.pyplot.bar( x, height - y, align-'center', alpha-0.5, color 'g') produces a bar graph with x-axis described by x and y axis described by y. Both x and y are lists here. matplotlib.pyplot.ylabel('Label Me') creates a label for the y axis called Label Me matplotlib.pyplot.title('Title Me) creates a title for the graph called Title Me 1. (10 points) (Without Python) In computer security applications, a honeypot is a trap set on a network to detect and counteract computer hackers. Honeypot data are studied in Kimou et al. (2010) using Markov chains. The authors obtained honeypot data from a central database and observed attacks against four computer ports - 80, 135, 139, and 445 - over 1 year. The ports are the states of a Markov chain along with a state corresponding to no port is attacked Let (Xn) be a SDTMC where Xn represents the port attacked with S 80, 135,139, 445, No attack). Weekly data are monitored, and the port most often attacked during the week is recorded. The estimated Markov transition matrix for weeklv attacks is 0 0 P1/16 3/16 3/8 1/4 1/8 with initial distribution v = (0.0.0.0. 1) (a) Which are the least and most likely attacked ports after 2 weeks? (You may need to use a computer for this calculation. Be sure to write down all of your steps and any new matrices that vou compute (b) Compute the probability that P, (X100 J) for all j E S. (You may need to use a computer for this calculation. Be sure to write down all of your steps and any new matrices that you compute.) 2. (30 points) (With Python) In this Python exercise, you will be estimating the probability each port is attacked after 100 weeks. Be sure to annotate your code with short explanations of what you are doing (worth 10 points) Suppose (as above) that each week the port most often attacked is recorded. The transition matrix for weekly attacks is P with initial distribution v (as above) (a) Simulate 100 weeks of attacks, and repeat the simulation 5,000 times. Compute the probability that each port is attacked after 100 weeks. Use the print function to print your answers. Be sure to label your results. For example, print ("The probability that Port %s is attacked after 100 weeks is %f", % (nameOfPort , prob0fPort)) (b) Create a bar graph to show the probability of attacks at each port after 100 weeks. Be sure to title your graph and label the axes. Save your graph and include it in your pdf file. (c) Take a screenshot showing your code and your results together (e.g. side by side) Python Code Hints * numpy.matrix will return a matrix from an array-like object or from a string of data. For example, a - numpy.matrix([[1, 2], [3, 4]]) will give you the matrix multiplication) and ** (matrix power). It has certain special operators, such as * (matrix . Change a matrix to a list via nameOfMyMatrix.tolist() [0] One way to make a bar graph is to use the library matplotlib. matplotlib.pyplot.bar( x, height - y, align-'center', alpha-0.5, color 'g') produces a bar graph with x-axis described by x and y axis described by y. Both x and y are lists here. matplotlib.pyplot.ylabel('Label Me') creates a label for the y axis called Label Me matplotlib.pyplot.title('Title Me) creates a title for the graph called Title Me 1. (10 points) (Without Python) In computer security applications, a honeypot is a trap set on a network to detect and counteract computer hackers. Honeypot data are studied in Kimou et al. (2010) using Markov chains. The authors obtained honeypot data from a central database and observed attacks against four computer ports - 80, 135, 139, and 445 - over 1 year. The ports are the states of a Markov chain along with a state corresponding to no port is attacked Let (Xn) be a SDTMC where Xn represents the port attacked with S 80, 135,139, 445, No attack). Weekly data are monitored, and the port most often attacked during the week is recorded. The estimated Markov transition matrix for weeklv attacks is 0 0 P1/16 3/16 3/8 1/4 1/8 with initial distribution v = (0.0.0.0. 1) (a) Which are the least and most likely attacked ports after 2 weeks? (You may need to use a computer for this calculation. Be sure to write down all of your steps and any new matrices that vou compute (b) Compute the probability that P, (X100 J) for all j E S. (You may need to use a computer for this calculation. Be sure to write down all of your steps and any new matrices that you compute.) 2. (30 points) (With Python) In this Python exercise, you will be estimating the probability each port is attacked after 100 weeks. Be sure to annotate your code with short explanations of what you are doing (worth 10 points) Suppose (as above) that each week the port most often attacked is recorded. The transition matrix for weekly attacks is P with initial distribution v (as above)