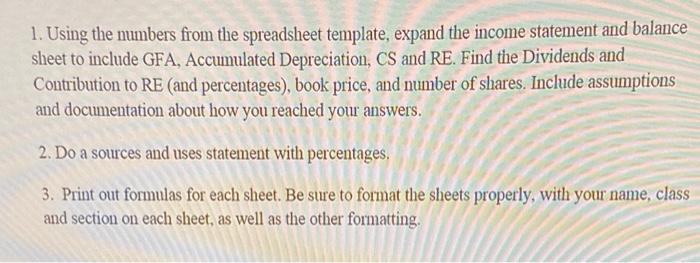
need help with the blank areas. 1. Using the numbers from the spreadsheet template, expand the income statement and balance sheet to include GFA, Accumulated
 need help with the blank areas.
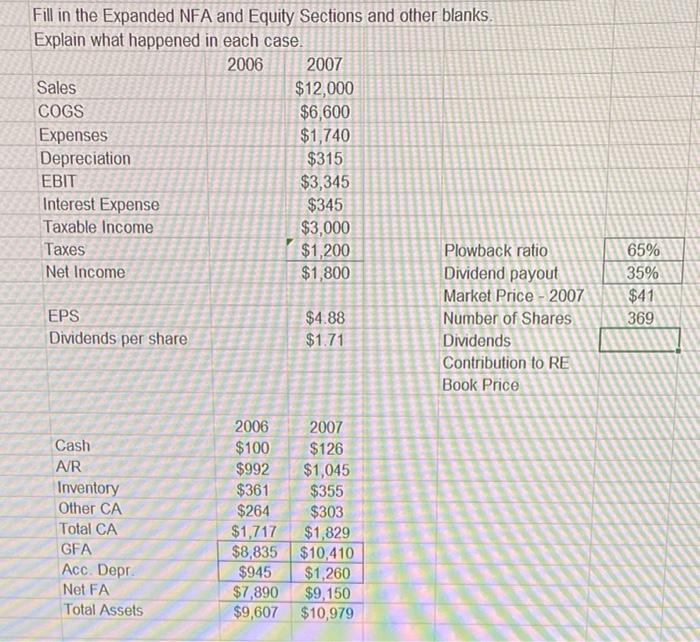
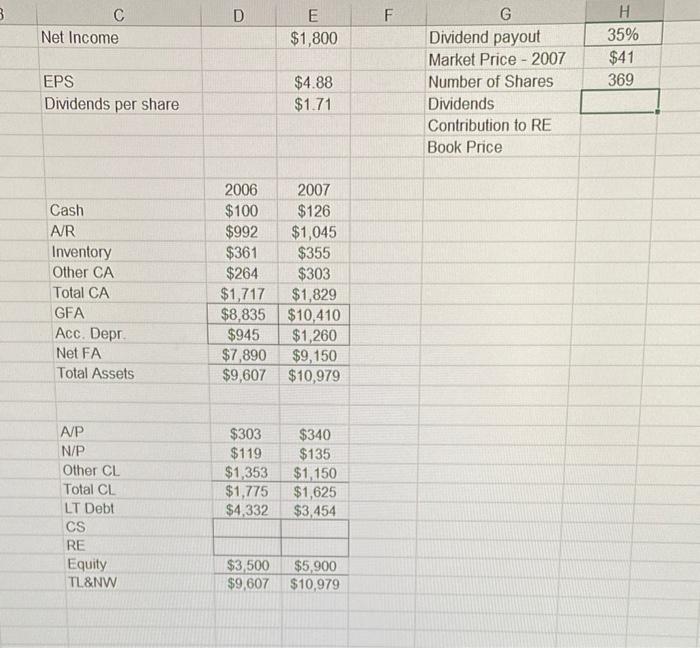
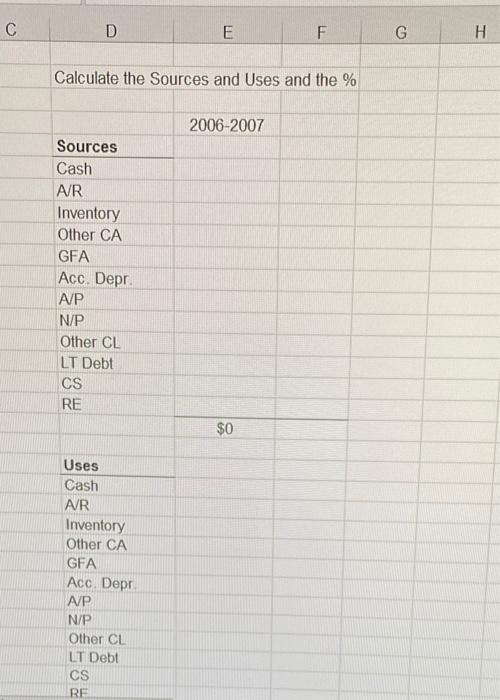
1. Using the numbers from the spreadsheet template, expand the income statement and balance sheet to include GFA, Accumulated Depreciation, CS and RE. Find the Dividends and Contribution to RE (and percentages), book price, and number of shares. Include assumptions and documentation about how you reached your answers. 2. Do a sources and uses statement with percentages. 3. Print out formulas for each sheet. Be sure to format the sheets properly, with your name, class and section on each sheet, as well as the other formatting. Fill in the Expanded NFA and Equity Sections and other blanks. Explain what happened in each case. 2006 Sales COGS Expenses Depreciation EBIT Interest Expense Taxable Income Taxes Net Income EPS Dividends per share Cash A/R Inventory Other CA Total CA GFA Acc. Depr. Net FA Total Assets 2006 $100 $992 $361 $264 $1,717 $8,835 $945 2007 $12,000 $6,600 $1,740 $315 $3,345 $345 $3,000 $1,200 $1,800 $4.88 $1.71 2007 $126 $1,045 $355 $303 $1,829 $10,410 $1,260 $7,890 $9,150 $9,607 $10,979 Plowback ratio Dividend payout Market Price - 2007 Number of Shares Dividends Contribution to RE Book Price 65% 35% $41 369 3 C Net Income EPS Dividends per share Cash A/R Inventory Other CA Total CA GFA Acc. Depr. Net FA Total Assets A/P N/P Other CL Total CL LT Debt CS RE Equity TL&NW D 2006 $100 $992 E $1,800 2007 $126 $1,045 $361 $355 $264 $303 $1,717 $8,835 $945 $4.88 $1.71 $1,829 $10,410 $1,260 $7,890 $9,150 $9,607 $10,979 $303 $340 $119 $135 $1,353 $1,150 $1,775 $1,625 $4,332 $3,454 $3,500 $5,900 $9,607 $10,979 F G Dividend payout Market Price 2007 Number of Shares Dividends Contribution to RE Book Price H 35% $41 369 C D Sources Cash A/R Calculate the Sources and Uses and the % Inventory Other CA GFA Acc. Depr. A/P N/P Other CL LT Debt CS RE Uses Cash A/R E Inventory Other CA GFA Acc. Depr. A/P N/P Other CL LT Debt CS RE 2006-2007 F $0 G H
Step by Step Solution
3.31 Rating (151 Votes )
There are 3 Steps involved in it
Step: 1

See step-by-step solutions with expert insights and AI powered tools for academic success
Step: 2

Step: 3

Ace Your Homework with AI
Get the answers you need in no time with our AI-driven, step-by-step assistance
Get Started


