Need Help with the
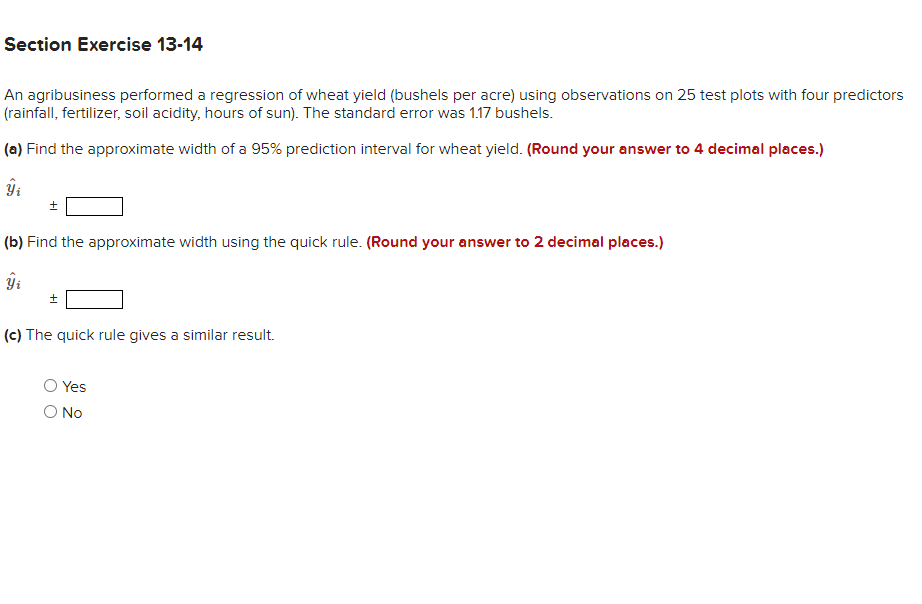
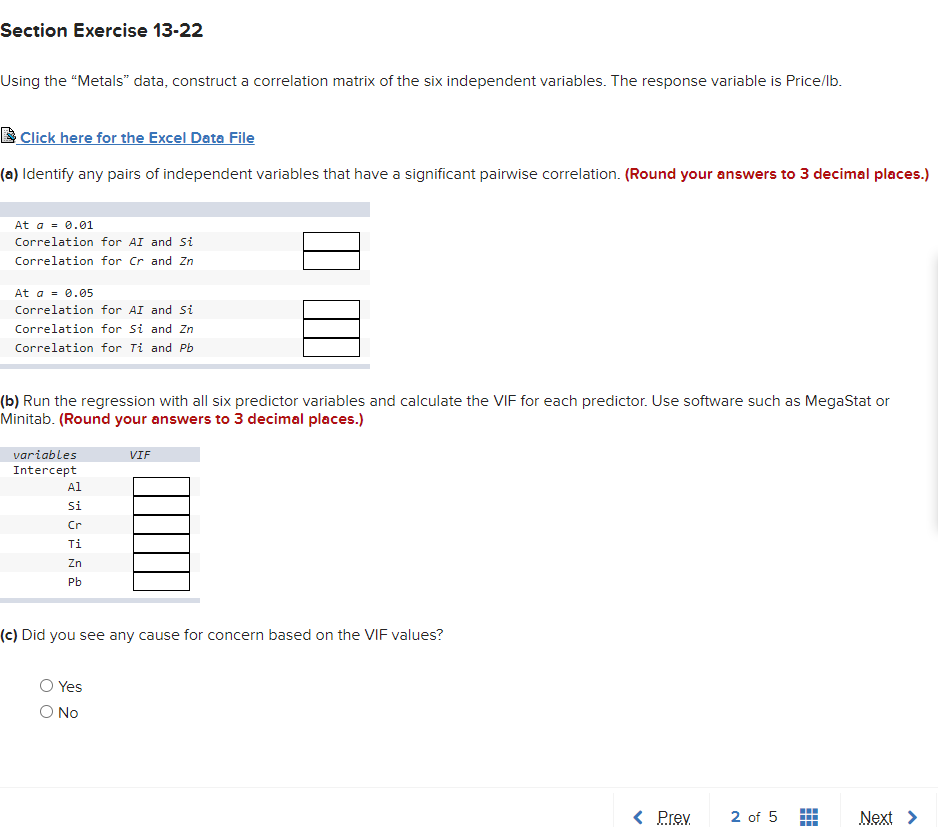
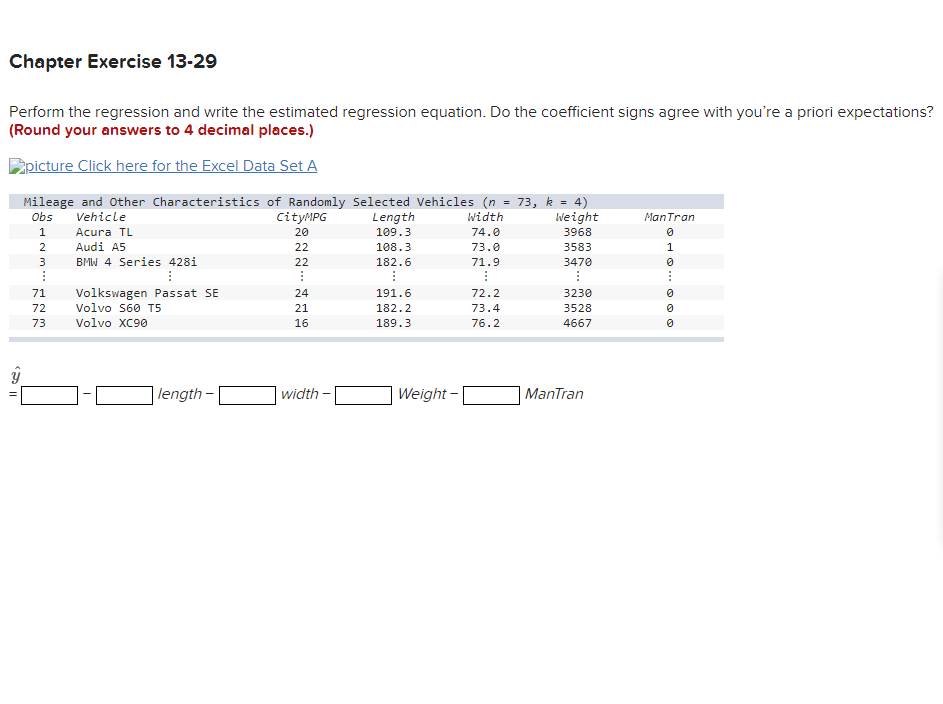
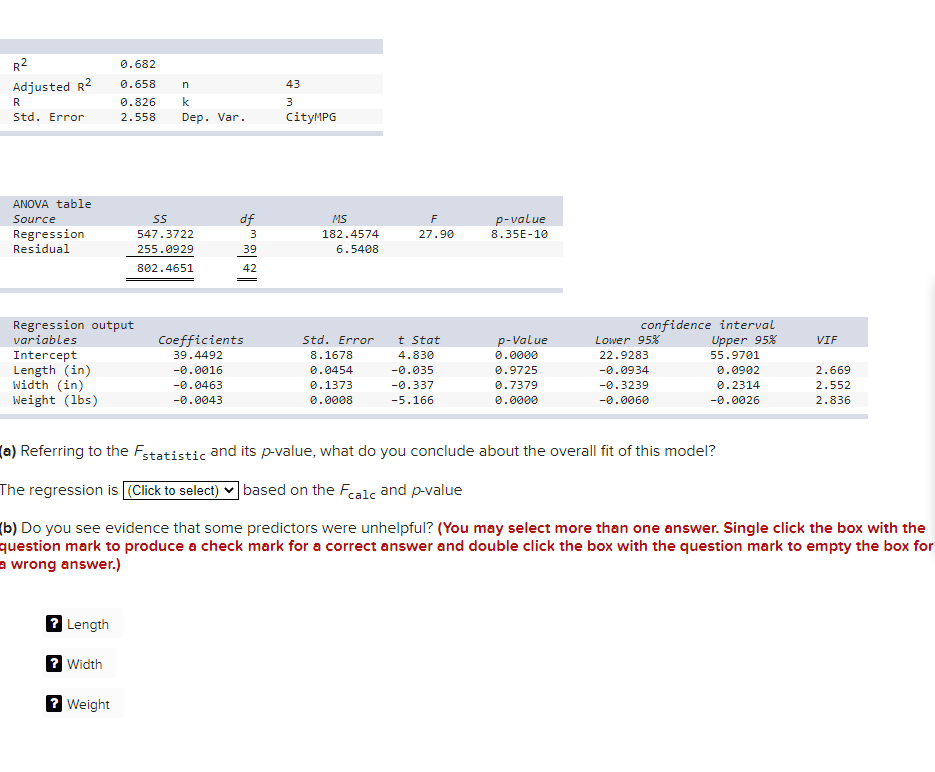
Section Exercise 13-14 An agribusiness performed a regression of wheat yield [bushels per acre} using observations on 25 test plots with four predictors (rainfall, fertilizer, soil acidity, hours of sun]. The standard error was 1.17 bushels. in] Find the approximate width of a 95% prediction interval for wheat yield. {Round your answer to 4 decimal places.) 4! Eli i lb} Find the approximate width using the quick rule. (Round your answer to 2 decimal places.) 3?:- i: [c] The quick rule gives a similar result. D Yes O No Section Exercise 13-22 Using the "Metals" data, construct a correlation matrix of the six independent variables. The response variable is Price/lb. Click here for the Excel Data File a) Identify any pairs of independent variables that have a significant pairwise correlation. (Round your answers to 3 decimal places.) At a = 0.01 Correlation for AI and Si Correlation for Cr and Zn At a = 0.05 Correlation for AI and Si Correlation for Si and Zn Correlation for Ti and Pb b) Run the regression with all six predictor variables and calculate the VIF for each predictor. Use software such as MegaStat or Minitab. (Round your answers to 3 decimal places.) variables VIF Intercept Al si Cr Ti Zn Pb (c) Did you see any cause for concern based on the VIF values? O Yes O No Chapter Exercise 13-29 Perform the regression and write the estimated regression equation. Do the coefficient signs agree with you're a priori expectations? (Round your answers to 4 decimal places.) Expicture Click here for the Excel Data Set A Mileage and Other Characteristics of Randomly Selected Vehicles (n = 73, k = 4) obs Vehicle CityMPG Length Width Weight Man Tran 1 Acura TL 20 109.3 74.0 3968 Audi A5 22 108.3 73.0 3583 BMW 4 Series 428i 22 182.6 71.9 3470 71 Volkswagen Passat SE 24 191.6 72.2 3230 72 Volvo 560 75 21 182. 2 73.4 3528 73 Volvo XC90 16 189.3 76.2 4667 length - width - Weight - ManTranR2 6.632 Adjusted R2 6.658 n 43 R 6 . 826 k 3 Std . Error 2 . 555 Dep . Var . City-MPG ARENA table Source 55 df MS F puatue Regression 54?.3?22 3 182.4524 27.96 8.35E16 Residual 255.6929 2 5.5468 862 . 4551 42 Regression output confidence interval variables Coefficients Std. Error t Stat p VaLue Lower 95}! Upper 953' VIF Intercept 39.4492 3.1625 4.336 6.6666 22.9253 55.9?61 Length (in) 6.6616 6.6454 6.635 6.9?25 6.6934 6.6962 2.669 'nlid'th (in) 6.6463 6.1323 6.33T" 6.2329 6.3239 6.2314 2.552 Height (lbs) 6.6643 6.6665 5.166 6.6666 6.6666 6.6625 2.836 {a} Referring to the Fstatistic and its Jourralue, what do you conclude about the overall fit of this model? The regression is (Click in select) v based on the Fcalc and pvalue Eb} Do you see evidence that some predictors were unhelpful? {You may select more than one answer. Single click the box with the question mark to produce a check mark for a correct answer and double click the box with the question mark to empty the box for a wrong answer.) Lengih Width Weight


