Need help with these questions first question is at the bottom and these questions are linked and nothing is missing
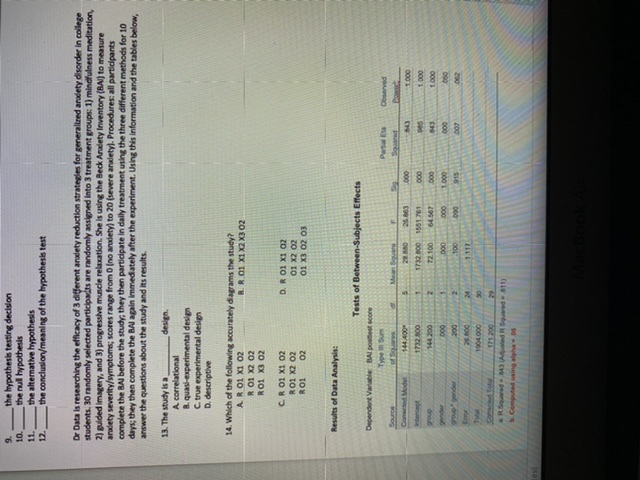
the hypothesis testing decision the null hypothesis the alternative hypotherdy the conclusion/meaning of the hypothesis test Or Data In researching the efficacy of 3 different anxiety reduction strategies for generalized aradety disorder In college students. 30 randomly selected participants are randomly assigned into 3 treatment groups: 1) mindfulness meditation, 2) guided Imagery, and 3] progressive mancle relocation. She Is using the Beck Arudety Inventory (BAI] to measure Brodety severity/symptoms; scores range from D (no anxiety) to 20 (severe andety). Procedures: all participants complete the BAI before the study, they then participate in daily treatment using the three different methods for 10 dry; they then complete the BAI a gain Immediately after the experiment. Using this information and the tables below. arewer the questions about the study and its results. 13. The study ha design. A. correlational B. quail-experimental design C. true experimental design D. descriptive 14. Which of the following accurately diagrams the study? A R OI X1 02 A R O1 21 12X302 R 01 X2 02 RO1 X3 02 C R O1 X1 02 D. R O1 X1 02 RO1 X2 01 01 X2 02 ROI 01 13 02 03 Results of Data Analyst: Tests of Between-Subjects Effects Dependent Variable: BAI portion The ill Sum Partal It Corebal Model 144.400 28 860 -1 0OO 1732 503 1732 800 1551 701 proup 144 200 1030 1009 200 1 117 Computed ining alpha's 01A. History B. Maturation C. Selection blan D. Mortality E. Instrumentation F. Stathtied regrowdon G. Testing 34. suppose that subjects were not randomly assigned to groups and that the guided Imagery group was significantly less anxious than the other two groups at pretest 35 Over time, extreme scores on the BAI moved closer to the group means 36. suppose that the BAI was used as the protest, but the Hamilton Anxiety Scales (HAM-A) was used at porttest 37. suppose that many of the subjects had test andety in addition to other anxiety, thus their BAI scores may be artificially elevated because they had to "take a test" 3.8. suppose that another arudety study at the same time was compensating each subject $100 for participation; thus, over half of Or Data's subjects quit her study to be in the paid one 99. suppose that, during the course of the study, the university had to shut down and go fully online, raising all students' anxiety levels 40. suppose that, during the course of the study, over half the subjects just spontaneously became much less andous True [T) or False (F] a hypothesis test is always a test of the null hypothesis If alpha is .01, then the probability of a Type I error Increases when testing for significant group differences, you typically want power to be high a paired samples t test is used with a within-subjects or repeated measures design 45 In an association claim research design, there are no possible threats to internal validity 46 If alpha = .05 and p value or Sig value is . 15, then you reject the null hypothesis _ multiple group comparisons are always conducted after a t-test of Independent samples external validity refers to the extent that sample findings can be generalized to the population 49. a true experiment is characterized by random assignment to groups, at least one experimental variable, and at least one control group a group means comparison study with two independent variables/factors - gender (male or female] and class ranking (FR, SO, JR, SR] and one dependent variable (GPA] would be analyzed with a 2x2 Factorial ANOVA.For questions 15 - 20, PTM = posttest mean; only consider the main affects of group A. Ho = PTM1 = PTMZ = PTM3 B. Ho = PTM1 + PTMZ = PTM3 C. Reject Ho D. Do Not Reject Ho E. There Is a significant main effect for treatment group F. There Is not a significant main effect for treatment group G. Large effect sire H. Small effect sire L. Low / poor power J. High / good power K. T-test of 3 Independent samples L One way ANOVA M. 2x2 Factorial ANOVA N. 2x3 Factorial ANOVA the correct null Ho for this test the correct decision regarding Ho the correct Initial interpretation of the Ho test 18 power level of this Ho test effect size for this Ho test name of the statistical test conducted above Use the following table and graph to answer questions 21 - 27 Multiple Comparisons Dependent Variable: BAI posttest score Schollo's Test Mean Difference ( Tx group Sad. Error mind winoss modivation guided imagery 4.60' 473 relation guided imagery mindfulness meditation 2 473 mindfulness meditation 4.TO' 473 progressive muscle 10 473Ho Is True Reject Ho Ho h Falun Do Not Reject Ho U a statistical power, 1 - Beta correct dechion ( find differences where they exist) correct dechion (fail to find differences when they do not edit) Type I error Type ll error alpha; significance level fake poultive lake negative In a study on depression, Or Data randomly assigned 20 subjects to 2 groups: The experimental group received 10 weeks of structured acceptance-commitment therapy and the wait list control group did not [ they received therapy after study completion). Depression was measured with the Beck Depression Inventory . BDI jocore range . 0-20, with higher scores Indicating more depression). To best the hypothesis that there was no spontaneous remission over the course of the study, Or. Data performed a paired samples t-test on the control group, comparing their pretest BDI score with their posttest BDI score. She obtained the output below: Paired Samples Statistics Sid Enor BOl protest 12.2030 Paired Samples Test Pand Offeringat A BD pretest : DOi posttest B. Wol pretest . BOI Poulter C. Reject Ho D. Do Not Reject Ho There wit no spontaneous remission during the study F. There was evidence of spontaneous reminion during the study MacBook AllBased on chin Estimated Marginal Means of BAI porttest score ginder Estimated BUTON PUBON IT guided modi tation imagery MUSCIO Tx group True [T] or False [F]7 all 3 PMs are relatively equal: no one treatment is any better than the other mindfulness meditation and guided imagery are significantly better than progressive muscle relocation 24 none of the 3 treatments appears to alleviate anxiety Willboth guided imagery and progressive muide relation are more effective than mindfulness meditation guided Imagery and progressive muscle relaxation are equally effective; one Is not better than the other 26. the graph shows a significant main effect for c and a significant Interaction between group and gender 27. In every group, women demonstrated more anciety relief than the men A. I-best of Independent temple B. I-test of dependent/ paired samples C. relationship/association between BAl pretest scores and BAI posttest scores D. mean and standard deviation of each treatment group at posttest E. Scheffe's tout would be used to compare the pretew/postbrut scores of the guided imagery group only the statistical test used in the post-hoc multiple comparisons best/table would be wied to compare the pouttest means of the mind viness meditation and guided imagery groups courelation / Pearson's nited States MacBook Air