

Answered step by step
Verified Expert Solution
Question
1 Approved Answer
need help with this problem Exercise 10 ABC Manufacturing Balance Sheet as of 2014 20,000 22,000 45,000 100,000 Liabilities Accounts Payable Accruals Notes Payable 34,000
need help with this problem 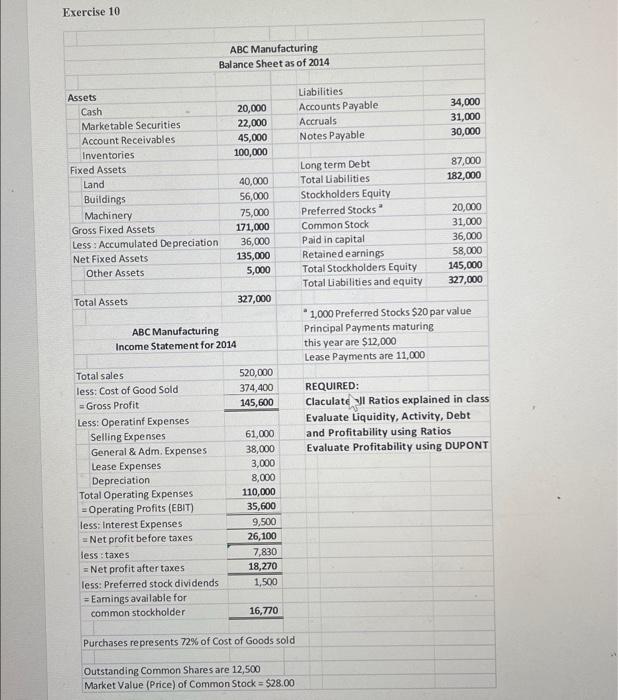
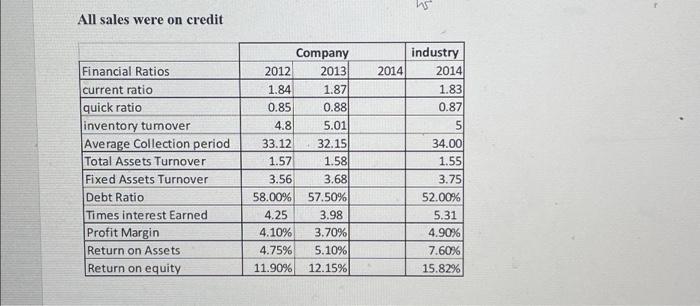
Exercise 10 ABC Manufacturing Balance Sheet as of 2014 20,000 22,000 45,000 100,000 Liabilities Accounts Payable Accruals Notes Payable 34,000 31,000 30,000 87,000 182,000 Assets Cash Marketable Securities Account Receivables Inventories Fixed Assets Land Buildings Machinery Gross Fixed Assets Less : Accumulated Depreciation Net Fixed Assets Other Assets 40,000 56,000 75,000 171,000 36,000 135,000 5,000 Long term Debt Total Liabilities Stockholders Equity Preferred Stocks Common Stock Paid in capital Retained earnings Total Stockholders Equity Total Liabilities and equity 20,000 31,000 36,000 58,000 145,000 327,000 Total Assets 327,000 ABC Manufacturing Income Statement for 2014 * 1,000 Preferred Stocks $20 par value Principal Payments maturing this year are $12,000 Lease Payments are 11,000 520,000 374,400 145,600 REQUIRED: Claculate Jl Ratios explained in class Evaluate Liquidity, Activity, Debt and Profitability using Ratios Evaluate Profitability using DUPONT Total sales less: Cost of Good Sold = Gross Profit Less: Operatinf Expenses Selling Expenses General & Adm. Expenses Lease Expenses Depreciation Total Operating Expenses = Operating profits (EBIT) less: Interest Expenses =Net profit before taxes less : taxes = Net profit after taxes less: Preferred stock dividends = Eamings available for common stockholder 61,000 38,000 3,000 8,000 110,000 35,600 9,500 26,100 7,830 18,270 1,500 16,770 Purchases represents 72% of Cost of Goods sold Outstanding Common Shares are 12,500 Market Value (Price) of Common Stock = $28.00 All sales were on credit 2014 industry 2014 1.83 0.87 5 Financial Ratios current ratio quick ratio inventory tumover Average Collection period Total Assets Turnover Fixed Assets Turnover Debt Ratio Times interest Earned Profit Margin Return on Assets Return on equity Company 2012 2013 1.84 1.87 0.85 0.88 4.8 5.01 33.12 32.15 1.57 1.58 3.56 3.68 58.00% 57.50% 4.25 3.98 4.10% 3.70% 4.75% 5.10% 11.90% 12.15% 34.00 1.55 3.75 52.00% 5.31 4.90% 7.60% 15.82% Step by Step Solution
There are 3 Steps involved in it
Step: 1

Get Instant Access to Expert-Tailored Solutions
See step-by-step solutions with expert insights and AI powered tools for academic success
Step: 2

Step: 3
Ace Your Homework with AI
Get the answers you need in no time with our AI-driven, step-by-step assistance
Get Started
Personal Finance Version 3.1
Authors: Rachel S. Siegel
3rd Edition
1453334807, 978-1453334805