

Answered step by step
Verified Expert Solution
Question
1 Approved Answer
Need number 2 answered for matlab, we just learned the basics of statistics. 1. Create a 100,000-element vector filled with Gaussian random numbers using the
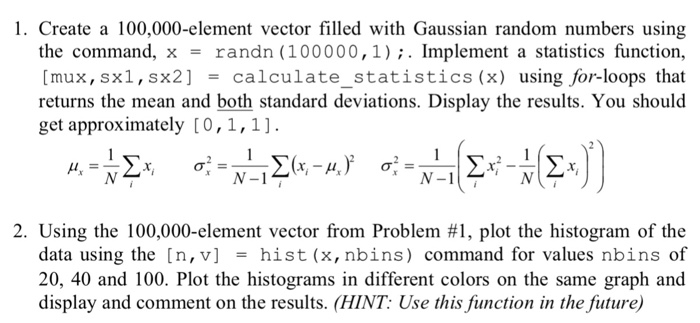 Need number 2 answered for matlab, we just learned the basics of statistics.
 Step by Step Solution
There are 3 Steps involved in it
Step: 1

Get Instant Access to Expert-Tailored Solutions
See step-by-step solutions with expert insights and AI powered tools for academic success
Step: 2

Step: 3
Ace Your Homework with AI
Get the answers you need in no time with our AI-driven, step-by-step assistance
Get Started
Privacy In Statistical Databases Unesco Chair In Data Privacy International Conference Psd 2008 Istanbul Turkey September 2008 Proceedings Lncs 5262
Authors: Josep Domingo-Ferrer ,Yucel Saygin
2008th Edition
3540874704, 978-3540874706