

Answered step by step
Verified Expert Solution
Question
1 Approved Answer
Need R code and Explanation. In this quesiton we will make use of two datasets. The gapminder data contains an excerpt of country - level
Need R code and Explanation.
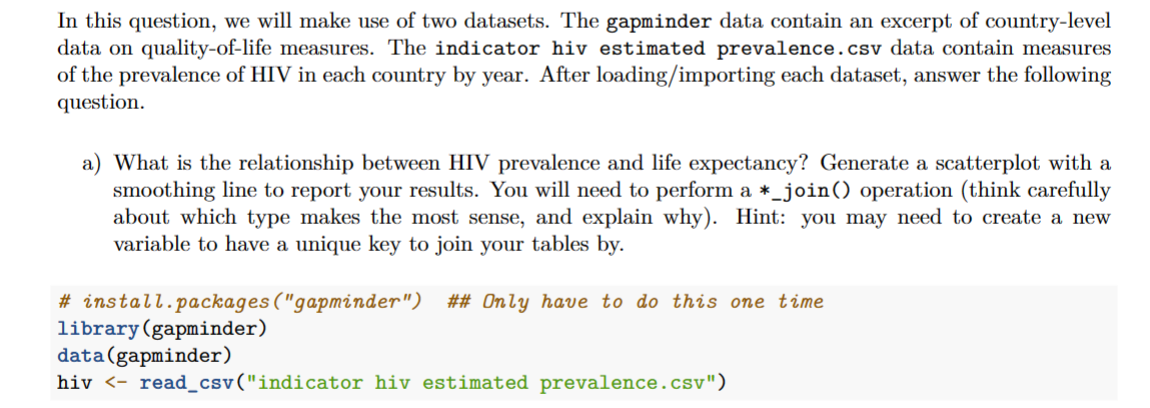
In this quesiton we will make use of two datasets. The gapminder data contains an excerpt of countrylevel data on the qualityoflife measures. The indicator hiv estimated prevalence.csv data contain a measures of the prevalence of HIV in each country by year. After loadingimporting each dataset, answer the following question.
a What is the relationship between HIV prevalence and life expectancy? Generate a scatterplot with a smoothing line to report your results. You will need to perform a join operation think carefully about which type makes the most sense and explain why Hint: You may need to create a new variable to have a unique key to join your tables by
Step by Step Solution
There are 3 Steps involved in it
Step: 1

Get Instant Access to Expert-Tailored Solutions
See step-by-step solutions with expert insights and AI powered tools for academic success
Step: 2

Step: 3
Ace Your Homework with AI
Get the answers you need in no time with our AI-driven, step-by-step assistance
Get Started
Moving Objects Databases
Authors: Ralf Hartmut Güting, Markus Schneider
1st Edition
0120887991, 978-0120887996