

Question
Need summary of below case: The development of Volvos big data service provides a terrific example of a case study with big data analytics used
Need summary of below case: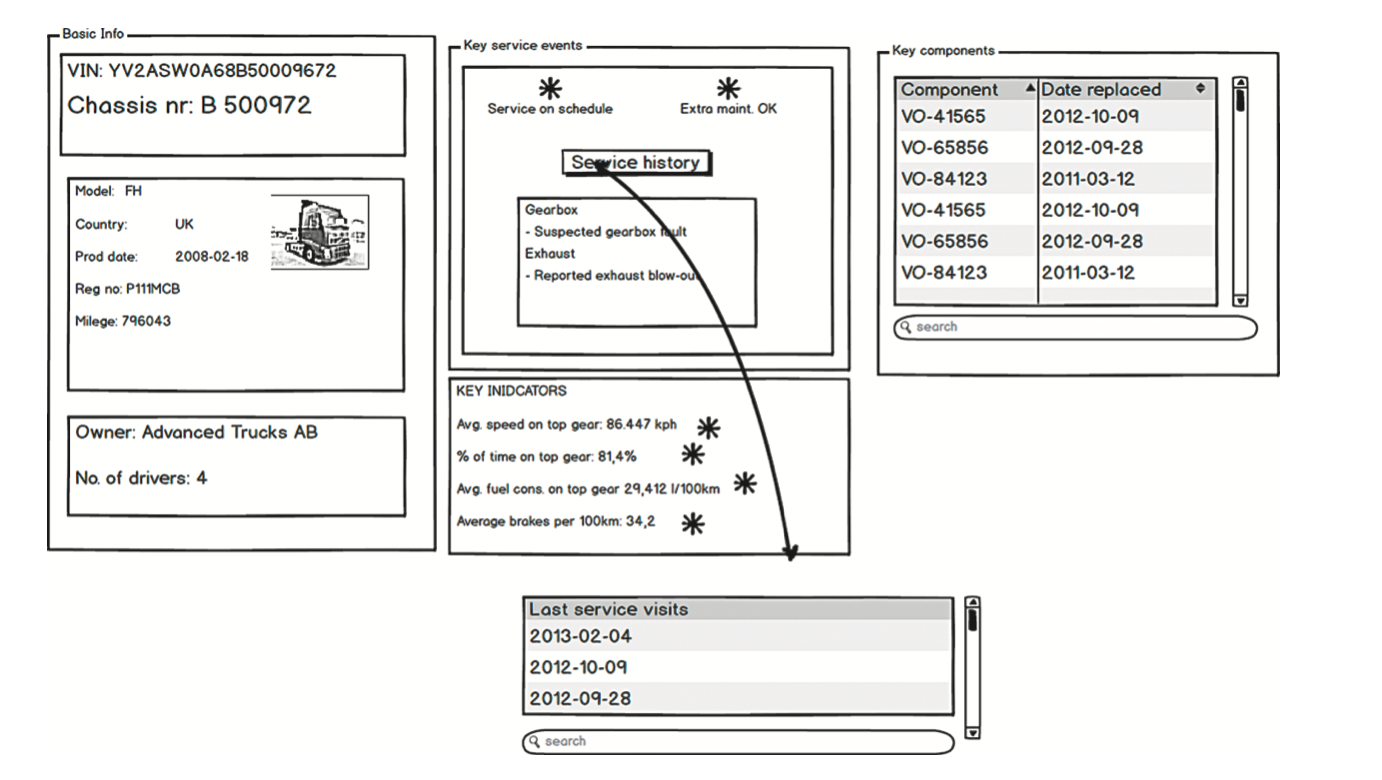
The development of Volvos big data service provides a terrific example of a case study with big data analytics used in the corporate world that contains a strong user-interface design component (Wozniak et al., 2015). But first a defini- tion: big data is defined (Google, 2015) as
Extremely large data sets that may be analyzed computationally to reveal patterns, trends, and associations, especially relating to human behavior and interactions.
In this case study, stakeholders were identified and empowered to help design the service (toolset) that would be used by the company. A diverse set of stakeholders (including many users) proved to be a success-oriented approach for this participatory design team. Stakeholders included the internal IT organi- zation, an invited (external) expert on big data implementations, database engi- neers, and business intelligence analysts. Workshops were held for the stakeholders as well as users of the data such as the organizations in charge of vehicle maintenance. The workshop attendees (representative stakeholders) strived to define how the results might appear and how they could be applied to the various stakeholder group missions. Attendees were encouraged to think outside the box in terms of potential uses for the data. They had to make sure the data were indeed collectable and would make sense to improve organiza- tion performance.
Taking huge datasets of Volvo truck service data and essentially prototyping the analysis output that could be performed worked successfully to identify the needed data in useful formats. In the workshop, a low-fidelity prototype was developed (see Fig. 6.4).
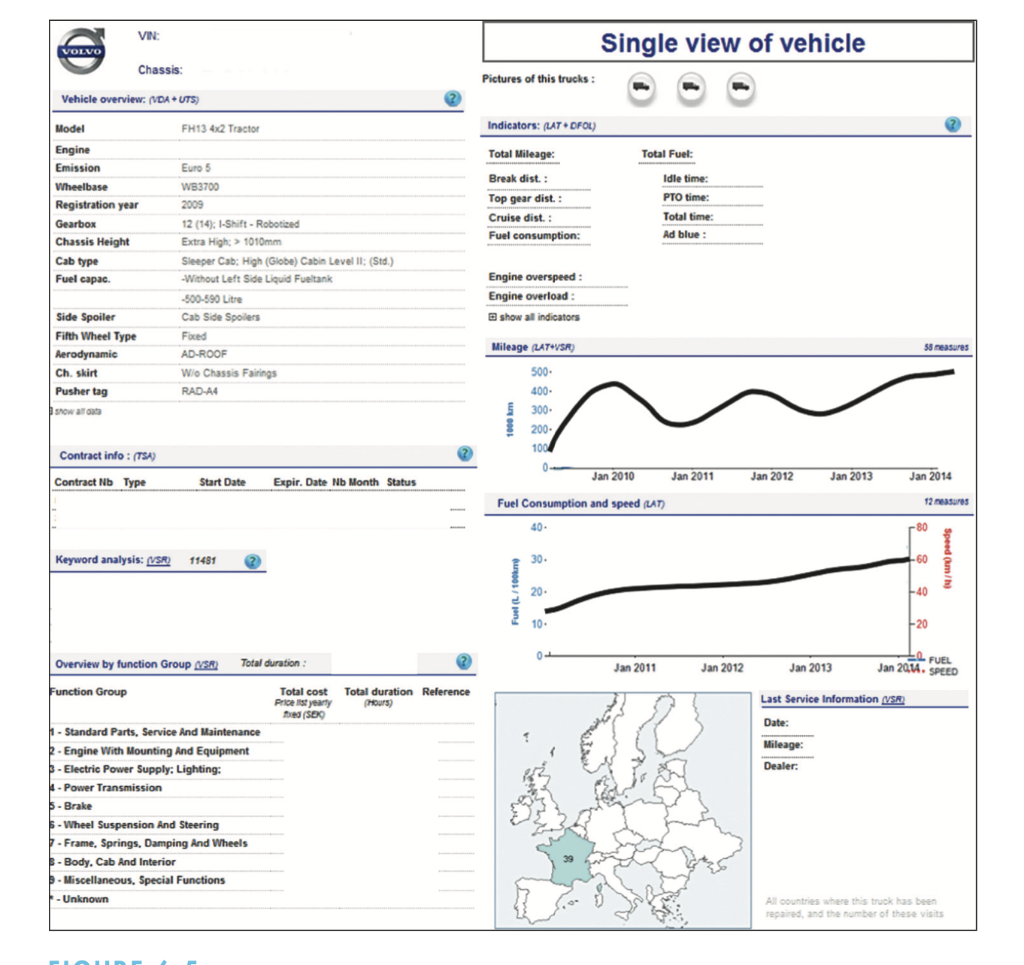
Through a series of refinements with representative users worldwide, this prototype evolved into something useful for all concerned. Fig. 6.5 shows a sample final version. Users could bring up advanced information about their products (vehicles) such as service history statistics, perform queries on market- specific issues, see maps of vehicle usage, highlight interesting values, and more.
A big data service was developed with user-customizable reports. Custom- ization played a crucial role in the design. Users involved in the process knew they would be able to choose features and rearrange views based on market-to- market differences. The study showed how following a user-interface develop- ment paradigm or development methodology led to a successful result that had buy-in from a distributed set of users. Indeed, if brokering organizational support is desired for a new innovation or product, a design-thinking work- shop of the sort practiced in this use case can be an effective technique.
The performers of the study learned to first identify sources of data while empowering the stakeholders of the data to choose what data they could use
(and how) in order to get their jobs done. Also, there were discussions in the workshops to analyze the data outputs. The final output was corporate big data policies that led to stakeholder-customizable report formats to better improve internal corporate communication and decision making. The tool is now used in all European Volvo truck dealerships.
Observations
There are some general observations worth making here. What was essentially a process for developing a big data analysis strategy, service design, and support- ing tools for a company to use to increase internal communication and profit- ability turned out to apply methods and processes taken from the world of user experience design and designing user interfaces! The authors applied a well- known methodology and an interface design paradigmthe process worked.
Often, user-interface processes are applied to business processes without the persons leading the change realizing its origin. For example, to analyze patient flow in a hospital (patient recordkeeping, scheduling of resources, service bottle- necks, prioritization of patient needs, etc.) may sound to some like a simple data- base or queueing problem or an application of business-process reengineering. However, when humans are mixed with sources of diverse data often in a time- sensitive environment, quick and easy access to critical data can make an organi- zation run more smoothly, better allocate resources, and lead to better decisions to improve customer satisfaction and patient outcomes. Knowing thy user, opti- mizing access to meaningful data, iteratively gathering feedback data, getting stakeholder buy-in, and so on, can all be accomplished using user-interface design and development methods as was performed in this case study.
Step by Step Solution
There are 3 Steps involved in it
Step: 1

Get Instant Access to Expert-Tailored Solutions
See step-by-step solutions with expert insights and AI powered tools for academic success
Step: 2

Step: 3
Ace Your Homework with AI
Get the answers you need in no time with our AI-driven, step-by-step assistance
Get Started
Lncs 5069 Scientific And Statistical Database Management 20th International Conference Ssdbm 2008 Hong Kong China July 9 11 2008 Proceedings
Authors: Bertram Ludascher ,Nikos Mamoulis
2008th Edition
3540694765, 978-3540694762