

Answered step by step
Verified Expert Solution
Question
1 Approved Answer
* needs to be done in R studio * 3. Download and inspect the file flower gender.csv. This file contains data on flower scent production
* needs to be done in R studio *
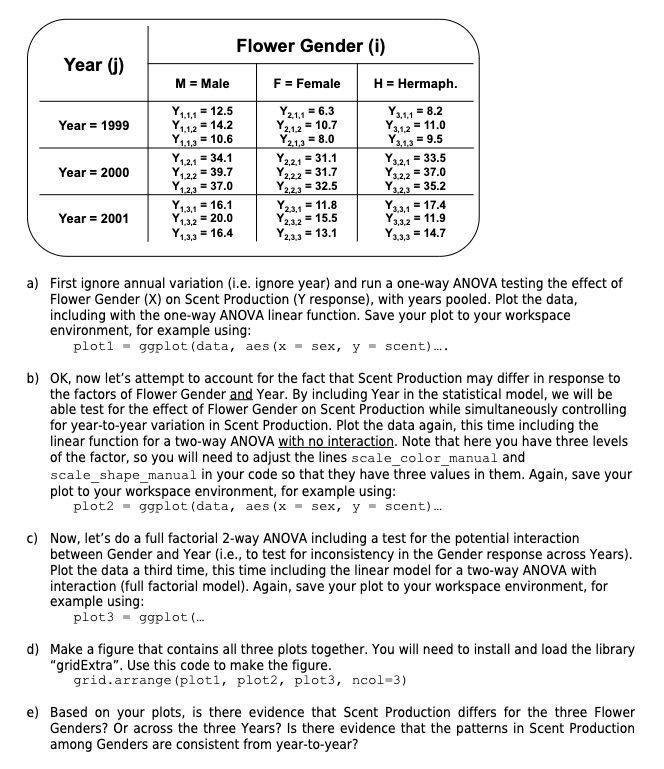
3. Download and inspect the file "flower gender.csv". This file contains data on flower scent production (pollen count, in mg ) for three different genders measured over three years. For this question, you are going to make plots of different ways we could visualize this model. Below is the data. a) First ignore annual variation (i.e. ignore year) and run a one-way ANOVA testing the effect of Flower Gender (X) on Scent Production ( Y response), with years pooled. Plot the data, including with the one-way ANOVA linear function. Save your plot to your workspace environment, for example using: plot1=ggplot(data,aes(x=sex,y=scent). b) OK, now let's attempt to account for the fact that Scent Production may differ in response to the factors of Flower Gender and Year. By including Year in the statistical model, we will be able test for the effect of Flower Gender on Scent Production while simultaneously controlling for year-to-year variation in Scent Production. Plot the data again, this time including the linear function for a two-way ANOVA with no interaction. Note that here you have three levels of the factor, so you will need to adjust the lines scale_color manual and scale_shape_manual in your code so that they have three values in them. Again, save your plot to your workspace environment, for example using: plot 2= ggplot ( data, aes (x= sex, y= scent ) c) Now, let's do a full factorial 2-way ANOVA including a test for the potential interaction between Gender and Year (i.e., to test for inconsistency in the Gender response across Years). Plot the data a third time, this time including the linear model for a two-way ANOVA with interaction (full factorial model). Again, save your plot to your workspace environment, for example using: plot 3=ggplot( d) Make a figure that contains all three plots together. You will need to install and load the library "gridExtra". Use this code to make the figure. grid.arrange (plot1, plot2, plot3, ncol=3) e) Based on your plots, is there evidence that Scent Production differs for the three Flower Genders? Or across the three Years? Is there evidence that the patterns in Scent Production among Genders are consistent from year-to-year? 3. Download and inspect the file "flower gender.csv". This file contains data on flower scent production (pollen count, in mg ) for three different genders measured over three years. For this question, you are going to make plots of different ways we could visualize this model. Below is the data. a) First ignore annual variation (i.e. ignore year) and run a one-way ANOVA testing the effect of Flower Gender (X) on Scent Production ( Y response), with years pooled. Plot the data, including with the one-way ANOVA linear function. Save your plot to your workspace environment, for example using: plot1=ggplot(data,aes(x=sex,y=scent). b) OK, now let's attempt to account for the fact that Scent Production may differ in response to the factors of Flower Gender and Year. By including Year in the statistical model, we will be able test for the effect of Flower Gender on Scent Production while simultaneously controlling for year-to-year variation in Scent Production. Plot the data again, this time including the linear function for a two-way ANOVA with no interaction. Note that here you have three levels of the factor, so you will need to adjust the lines scale_color manual and scale_shape_manual in your code so that they have three values in them. Again, save your plot to your workspace environment, for example using: plot 2= ggplot ( data, aes (x= sex, y= scent ) c) Now, let's do a full factorial 2-way ANOVA including a test for the potential interaction between Gender and Year (i.e., to test for inconsistency in the Gender response across Years). Plot the data a third time, this time including the linear model for a two-way ANOVA with interaction (full factorial model). Again, save your plot to your workspace environment, for example using: plot 3=ggplot( d) Make a figure that contains all three plots together. You will need to install and load the library "gridExtra". Use this code to make the figure. grid.arrange (plot1, plot2, plot3, ncol=3) e) Based on your plots, is there evidence that Scent Production differs for the three Flower Genders? Or across the three Years? Is there evidence that the patterns in Scent Production among Genders are consistent from year-to-yearStep by Step Solution
There are 3 Steps involved in it
Step: 1

Get Instant Access to Expert-Tailored Solutions
See step-by-step solutions with expert insights and AI powered tools for academic success
Step: 2

Step: 3
Ace Your Homework with AI
Get the answers you need in no time with our AI-driven, step-by-step assistance
Get Started
Financial Accounting Tools For Business Decision Making WileyPLUS NextGen Card Single Semester
Authors: Paul D. Kimmel ,Jerry J. Weygandt ,Donald E. Kieso
10th Edition
1119791022, 978-1119791027