

Answered step by step
Verified Expert Solution
Question
1 Approved Answer
Needs to be in python only. Needs to be in python only. Show transcribed image text Project #3 ~ water Quality In recent years, there
Needs to be in python only.
Needs to be in python only.
Show transcribed image text
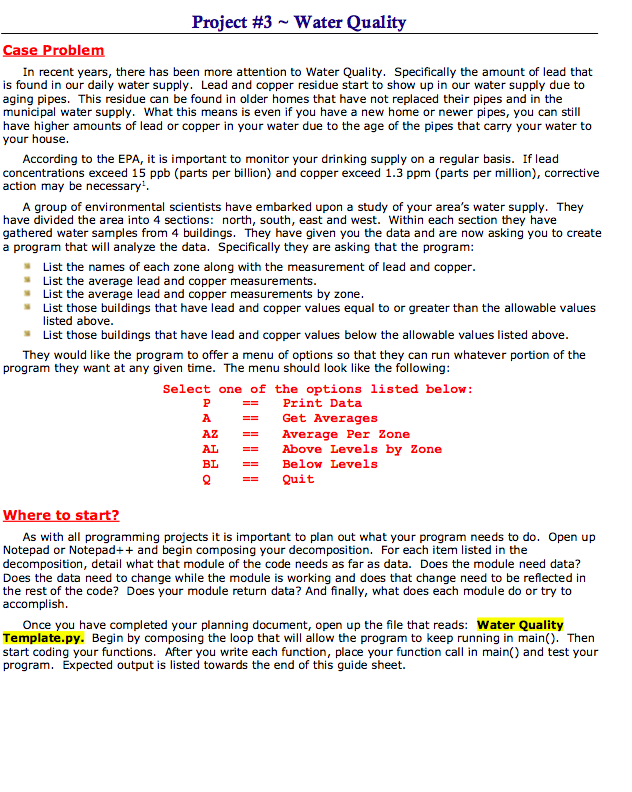
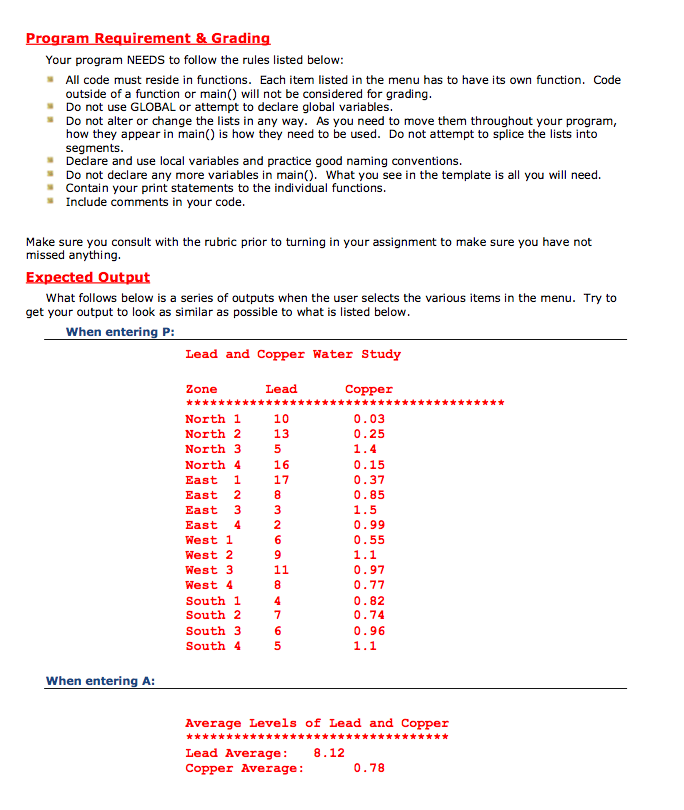
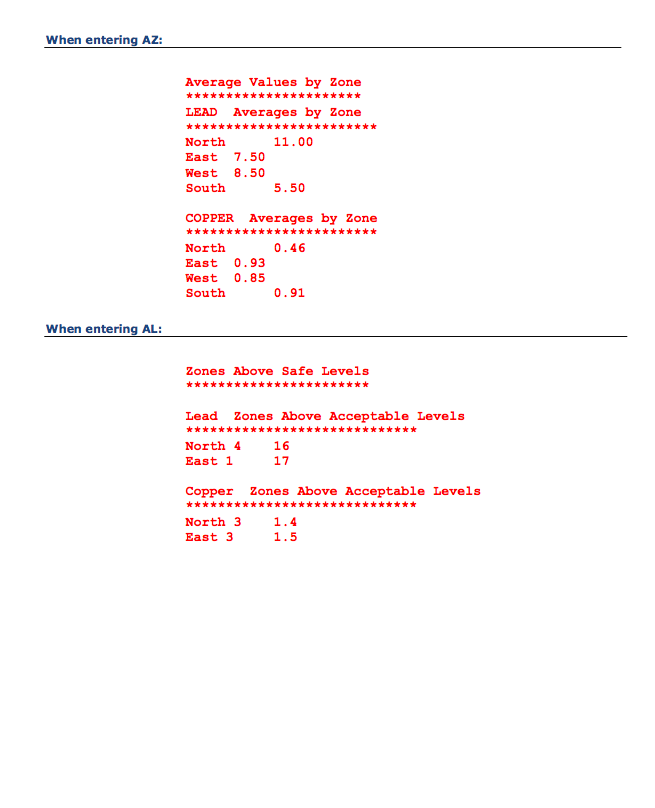
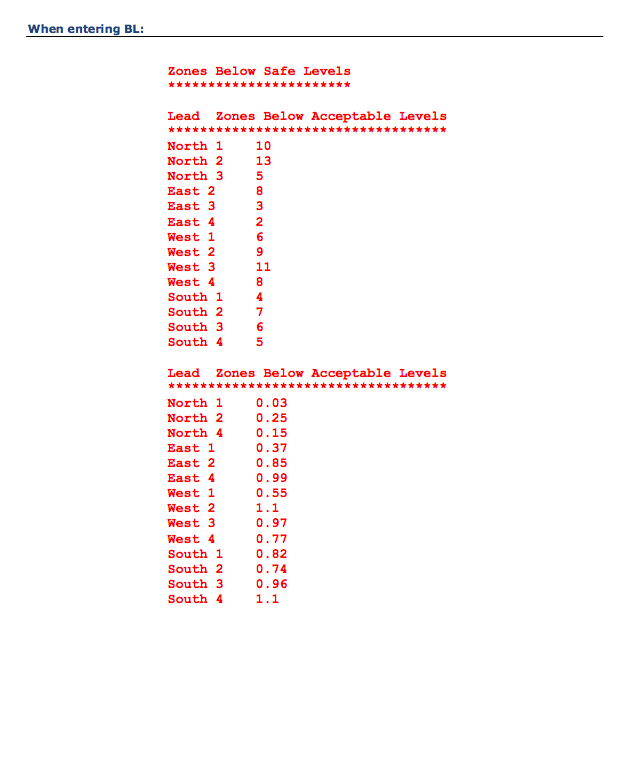
Project #3 ~ water Quality In recent years, there has been more attention to Water Quality. Specifically the amount of lead that is found in our daily water supply. Lead and copper residue start to show up in our water supply due to aging pipes. This residue can be found in older homes that have not replaced their pipes and in the municipal water supply. What this means is even if you have a new home or newer pipes, you can still have higher amounts of lead or copper in your water due to the age of the pipes that carry your water to your house According to the EPA, it is important to monitor your drinking supply on a regular basis. If lead concentrations exceed 15 ppb (parts per billion) and copper exceed 1.3 ppm (parts per million), corrective action may be necessary A group of environmental scientists have embarked upon a study of your area's water supply. They have divided the area into 4 sections: north, south, east and west. Within each section they have gathered water samples from 4 buildings. They have given you the data and are now asking you to create a program that will analyze the data. Specifically they are asking that the program List the names of each zone along with the measurement of lead and copper List the average lead and copper measurements List the average lead and copper measurements by zone List those buildings that have lead and copper values equal to or greater than the allowable values listed above List those buildings that have lead and copper values below the allowable values listed above They would like the program to offer a menu of options so that they can run whatever portion of the program they want at any given time. The menu should look like the following Select one of the options listed below == Print Data == Get Averages AZ = Average Per Zone AL Above Levels by Zone BL == Below Levels -Quit As with all programming projects it is important to plan out what your program needs to do. Open up Notepad or Notepad++ and begin composing your decomposition. For each item listed in the decomposition, detail what that module of the code needs as far as data. Does the module need data? Does the data need to change while the module is working and does that change need to be reflected in the rest of the code? Does your module return data? And finally, what does each module do or try to accomplish Once you have completed your planning document, open up the file that reads: Water Quality Template.py. Begin by composing the loop that will allow the program to keep running in main Then start coding your functions. After you write each function, place your function call in main() and test your program. Expected output is listed towards the end of this guide sheetStep by Step Solution
There are 3 Steps involved in it
Step: 1

Get Instant Access to Expert-Tailored Solutions
See step-by-step solutions with expert insights and AI powered tools for academic success
Step: 2

Step: 3
Ace Your Homework with AI
Get the answers you need in no time with our AI-driven, step-by-step assistance
Get Started
Database Design And Relational Theory Normal Forms And All That Jazz
Authors: Chris Date
1st Edition
1449328016, 978-1449328016