

Question: NEW Create a figure. Create two subplots in the figure, side-by-side (see subplot(:)). On the left subplot, plot all values in the third channel of
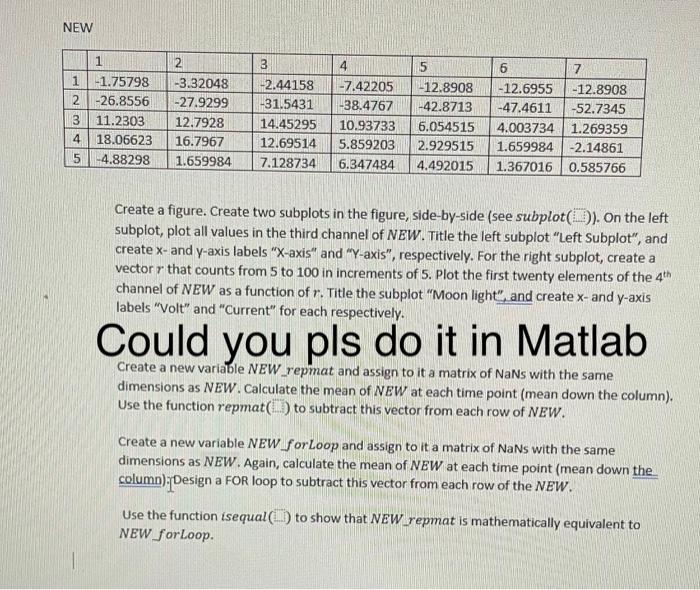
NEW Create a figure. Create two subplots in the figure, side-by-side (see subplot(:)). On the left subplot, plot all values in the third channel of NEW. Title the left subplot "Left Subplot", and create x - and y-axis labels " X-axis" and " Y-axis", respectively. For the right subplot, create a vector r that counts from 5 to 100 in increments of 5. Plot the first twenty elements of the 4th channel of NEW as a function of r. Title the subplot "Moon light", and create x-and y-axis labels "Volt" and "Current" for each respectively. Could you pls do it in Matlab Create a new variable NEW_repmat and assign to it a matrix of NaNs with the same dimensions as NEW. Calculate the mean of NEW at each time point (mean down the column). Use the function repmat ( ) to subtract this vector from each row of NEW. Create a new variable NEW forLoop and assign to it a matrix of NaNs with the same dimensions as NEW. Again, calculate the mean of NEW at each time point (mean down the column):Design a FOR loop to subtract this vector from each row of the NEW. Use the function isequal ( ) to show that NEW repmat is mathematically equivalent to NEW forloop
Step by Step Solution
There are 3 Steps involved in it

Get step-by-step solutions from verified subject matter experts