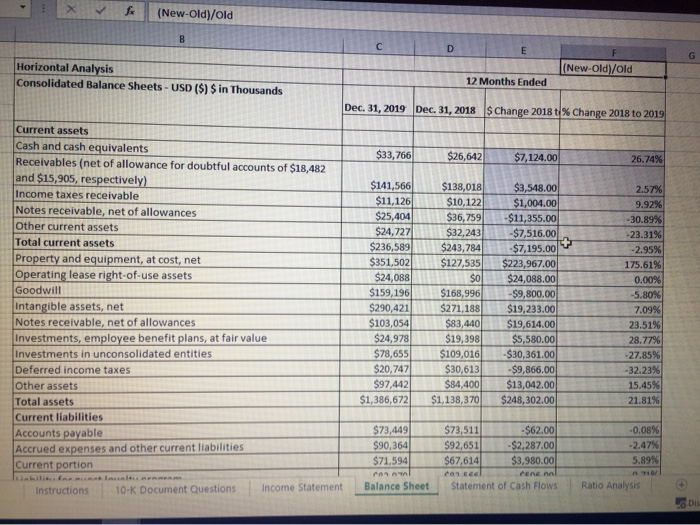
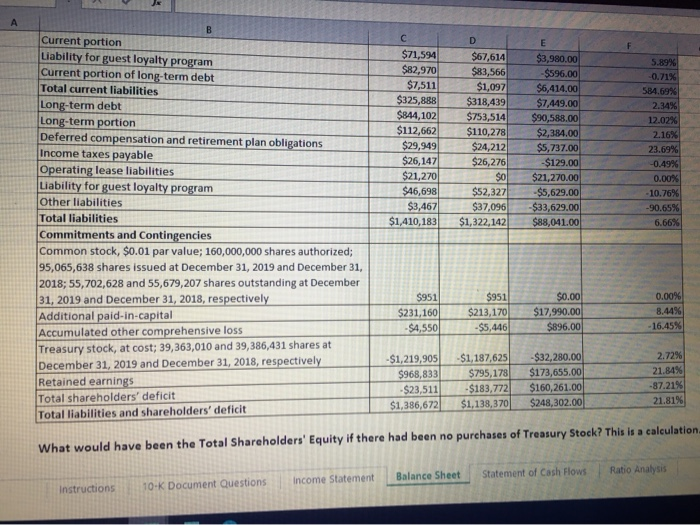
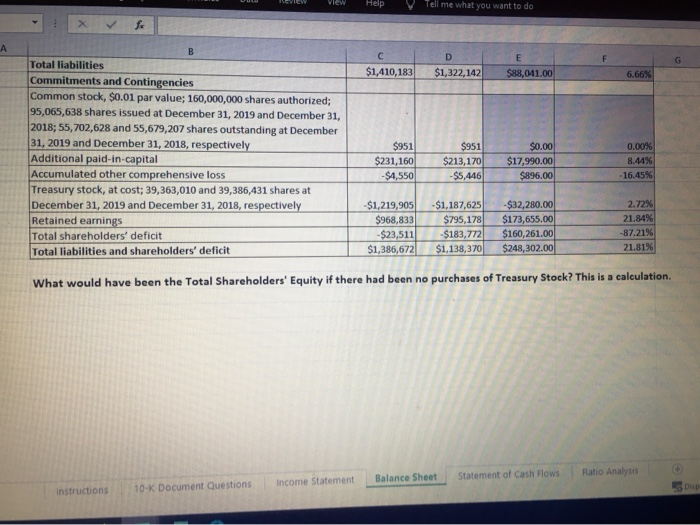
(New-Old)/old (New.oldold (New-Old)/old Horizontal Analysis Consolidated Balance Sheets - USD ($) $ in Thousands 12 Months Ended Dec 31, 2019 Dec 31, 2018 $ Change 2018 t % Change 2018 to 2019 $33,766 $26,642 $7,124.00 26.74% Current assets Cash and cash equivalents Receivables (net of allowance for doubtful accounts of $18,482 and $15,905, respectively) Income taxes receivable Notes receivable, net of allowances Other current assets Total current assets Property and equipment, at cost, net Operating lease right-of-use assets Goodwill Intangible assets, net Notes receivable, net of allowances Investments, employee benefit plans, at fair value Investments in unconsolidated entities Deferred income taxes Other assets Total assets Current liabilities Accounts payable Accrued expenses and other current liabilities Current portion $141,566 $11,126 $25,404 $24,7271 $236,589 $351,502 $24,088 $159, 1961 $290,421 $103,054 $24,978 $78,655 $20,747 $97,442 $1,386,672 $138,018 $10,122 $36,759 $32,243 $243,784 $127,535 $0 $168,996 $271,188 $83,440 $19,398 $109,016 $30,613 $84,400 $1,138,370 $3,548.00 $1,004.00 $11,355.00 $7,516.00 -$7,195.00 $223,967.00 $24,088.00 -$9,800.00 $19,233.00 $19,614.00 $5,580.00 -$30,361.00 -$9,866.00 $13,042.00 $248,302.00 2.57% 9.92% -30.89% -23.31% -2.95% 175.61% 0.00% -5.80% 7.09% 23.51% 28.77% -27.85% -32.23% 15.45% 21.81% $73,449 $90,364 $71,594 $73,511 -$62.00 $92,651 $92,651 $2,287.00 $67,614 $3,980.00 can see Cene na Statement of Cash Flows -0.08% -2.47% 5.89% Instructions 10- Document Questions Income Statement Balance Sheet Ratio Analysis DIS C D $67,614 $83,566 $1,097 $318,439 $753,514 $110,278 $24,212 $82,970 $7,511 $325,888 $844,102 $112,662 $29,949 $26,147 $21,270 $46,698 $3,467 $1,410,183 EL $3,980.00 $596.00 $6,414.00 $7,449.00 $90,588.00 $2,384.00 $5,737.00 $129.00 $21,270.00 $5,629.00 -$33,629.00 $88,041.00 Current portion Liability for guest loyalty program Current portion of long-term debt Total current liabilities Long-term debt Long-term portion Deferred compensation and retirement plan obligations Income taxes payable Operating lease liabilities Liability for guest loyalty program Other liabilities Total liabilities Commitments and Contingencies Common stock, $0.01 par value; 160,000,000 shares authorized; 95,065,638 shares issued at December 31, 2019 and December 31, 2018; 55,702,628 and 55,679,207 shares outstanding at December 31, 2019 and December 31, 2018, respectively Additional paid-in-capital Accumulated other comprehensive loss Treasury stock, at cost; 39,363,010 and 39,386,431 shares at December 31, 2019 and December 31, 2018, respectively Retained earnings Total shareholders' deficit Total liabilities and shareholders' deficit 5.89% 0.71% 584.69% 2.34% 12.02% 2.16% 23.69% -0.49% 0.00% - 10.76% -90.65% 6.66% $0 $52,327 $37,096 $1,322,142| $951 $231,160 -$4,550 $951 $213,170 -$5,446 $0.00 $17,990.00 $896.00 0.00% 8.44% -16.45% 2 -$1,219,905) $968,833 -$23,511 $1,386,672 $1,187,625 $795,178 $183,772 $1,138,370 $32,280. 00 $173,655.00 $160, 261.00 $248,302.00 .72% 21.84% 87.21% 21.81% What would have been the Total Shareholders' Equity if there had been no purchases of Treasury Stock? This is a calculation, Balance Sheet income Statement Statement of Cash Flows Ratio Analysis Instructions 10-K Document Questions Help Tell me what you want to do DI $1,322,142 $1,410,183 8 Total liabilities Commitments and Contingencies Common stock, $0.01 par value; 160,000,000 shares authorized; 95,065,638 shares issued at December 31, 2019 and December 31, 2018; 55,702,628 and 55,679,207 shares outstanding at December 31, 2019 and December 31, 2018, respectively Additional paid-in-capital Accumulated other comprehensive loss Treasury stock, at cost; 39,363,010 and 39,386,431 shares at December 31, 2019 and December 31, 2018, respectively Retained earnings Total shareholders' deficit Total liabilities and shareholders' deficit $951 $231,160 $4,550 $951 $213,170 $5,446 $0.00 $17,990.00 $896.00 0.00% 8.44% 16.45% -$1,219,905 $968,833 -$23,511 $1,386,672 $1,187,625 $795,178) $183,772 $1,138,370 $32,280.00 $173,655.00 $160,261.00 $248,302.00 2.72% 21.84% -87.21% 21.81% What would have been the Total Shareholders' Equity if there had been no purchases of Treasury Stock? This is a calculation. Statement of Cash Flows Ratio Analysis Balance Sheet income Statement Instructions 10-K Document Questions ho Dup