

Answered step by step
Verified Expert Solution
Question
1 Approved Answer
not even close to sure where to start Table 2: Part B - Determination of Sugar Content in Beverages Table 3: Part C - Determination
not even close to sure where to start
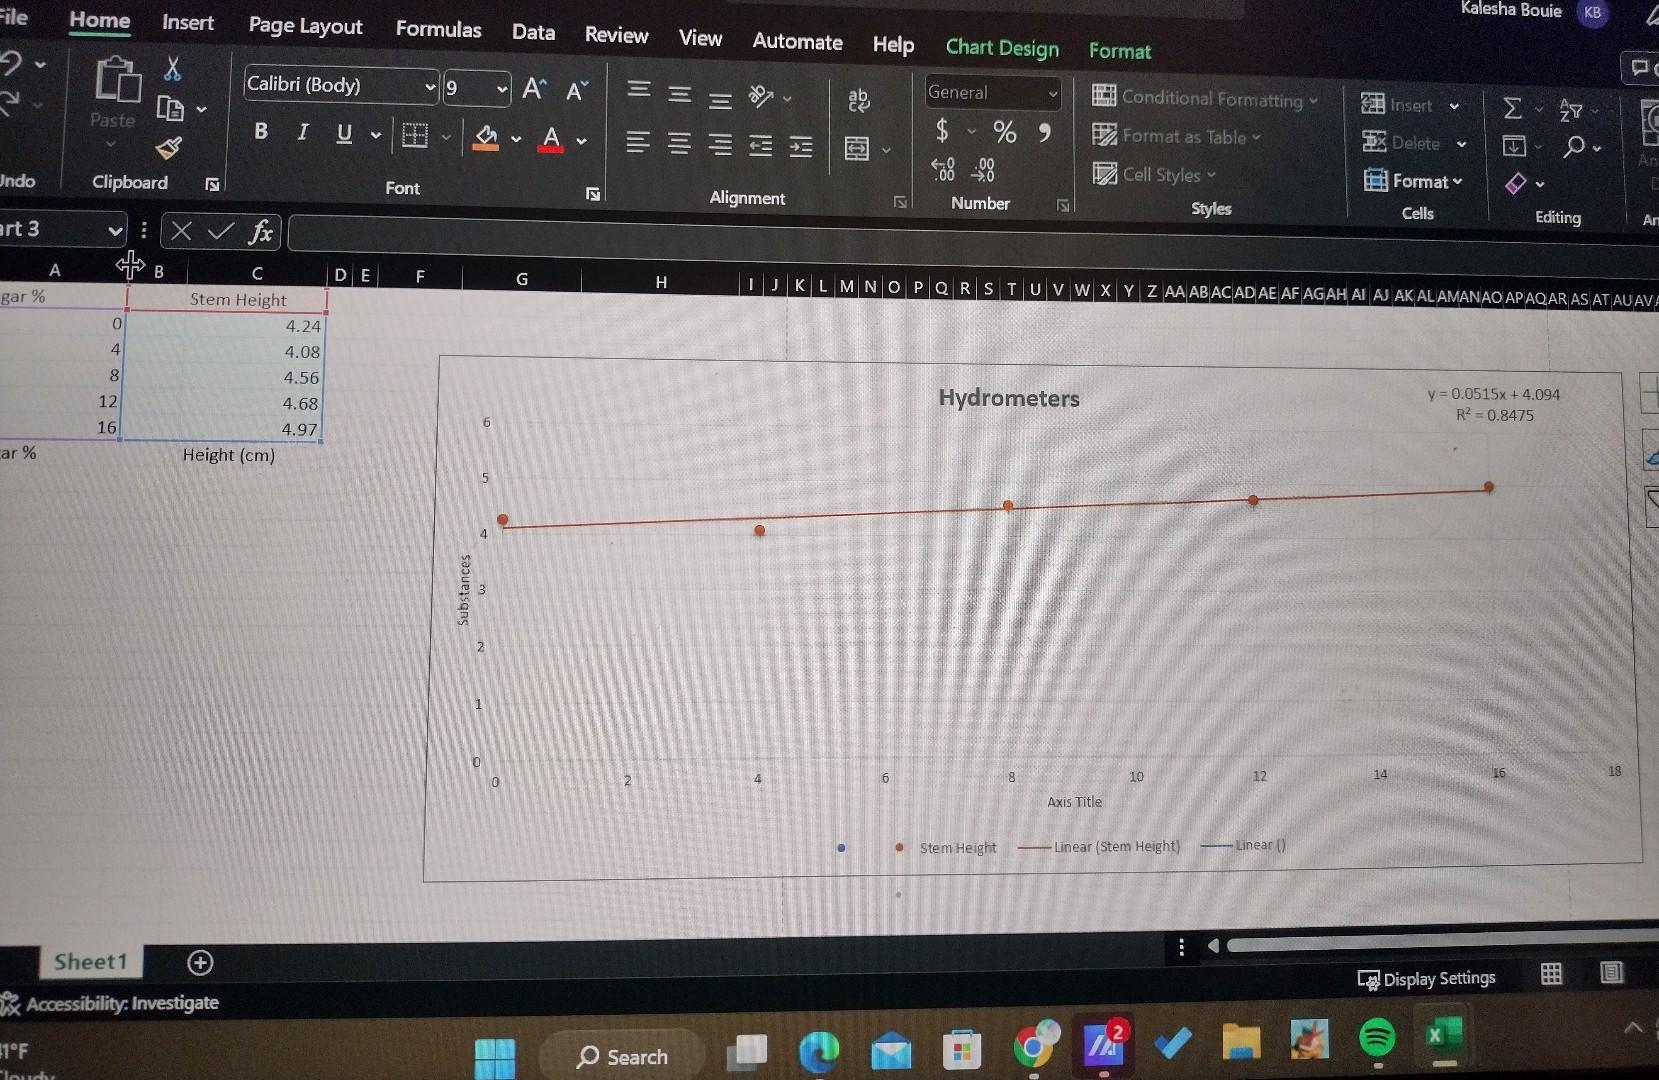
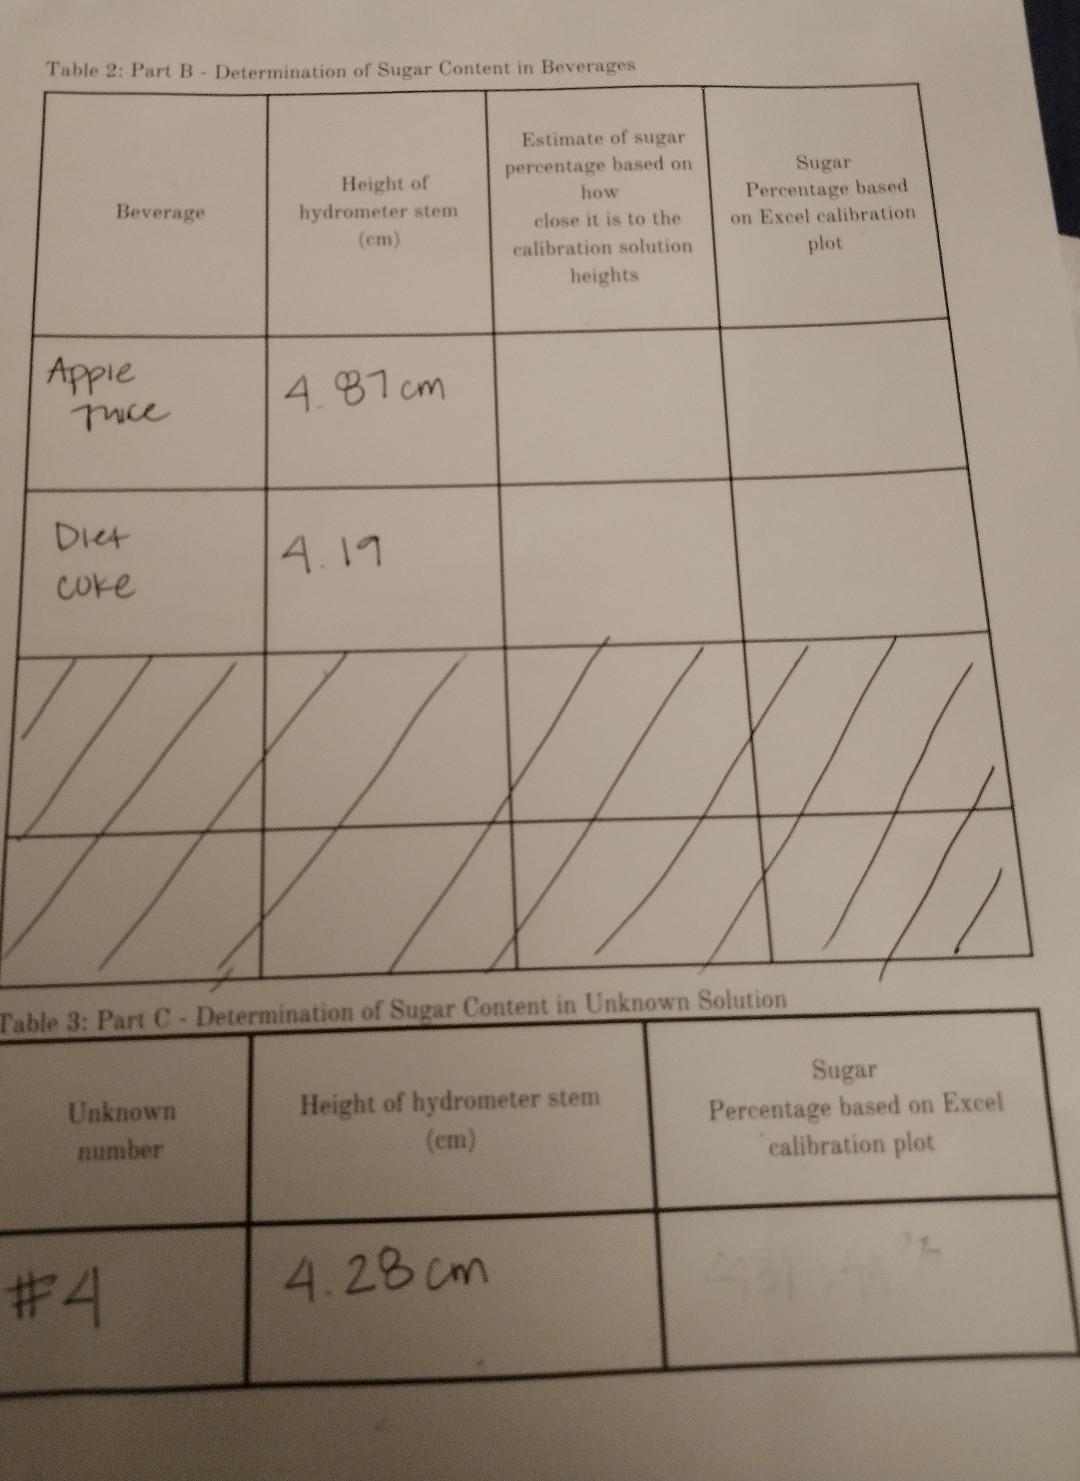
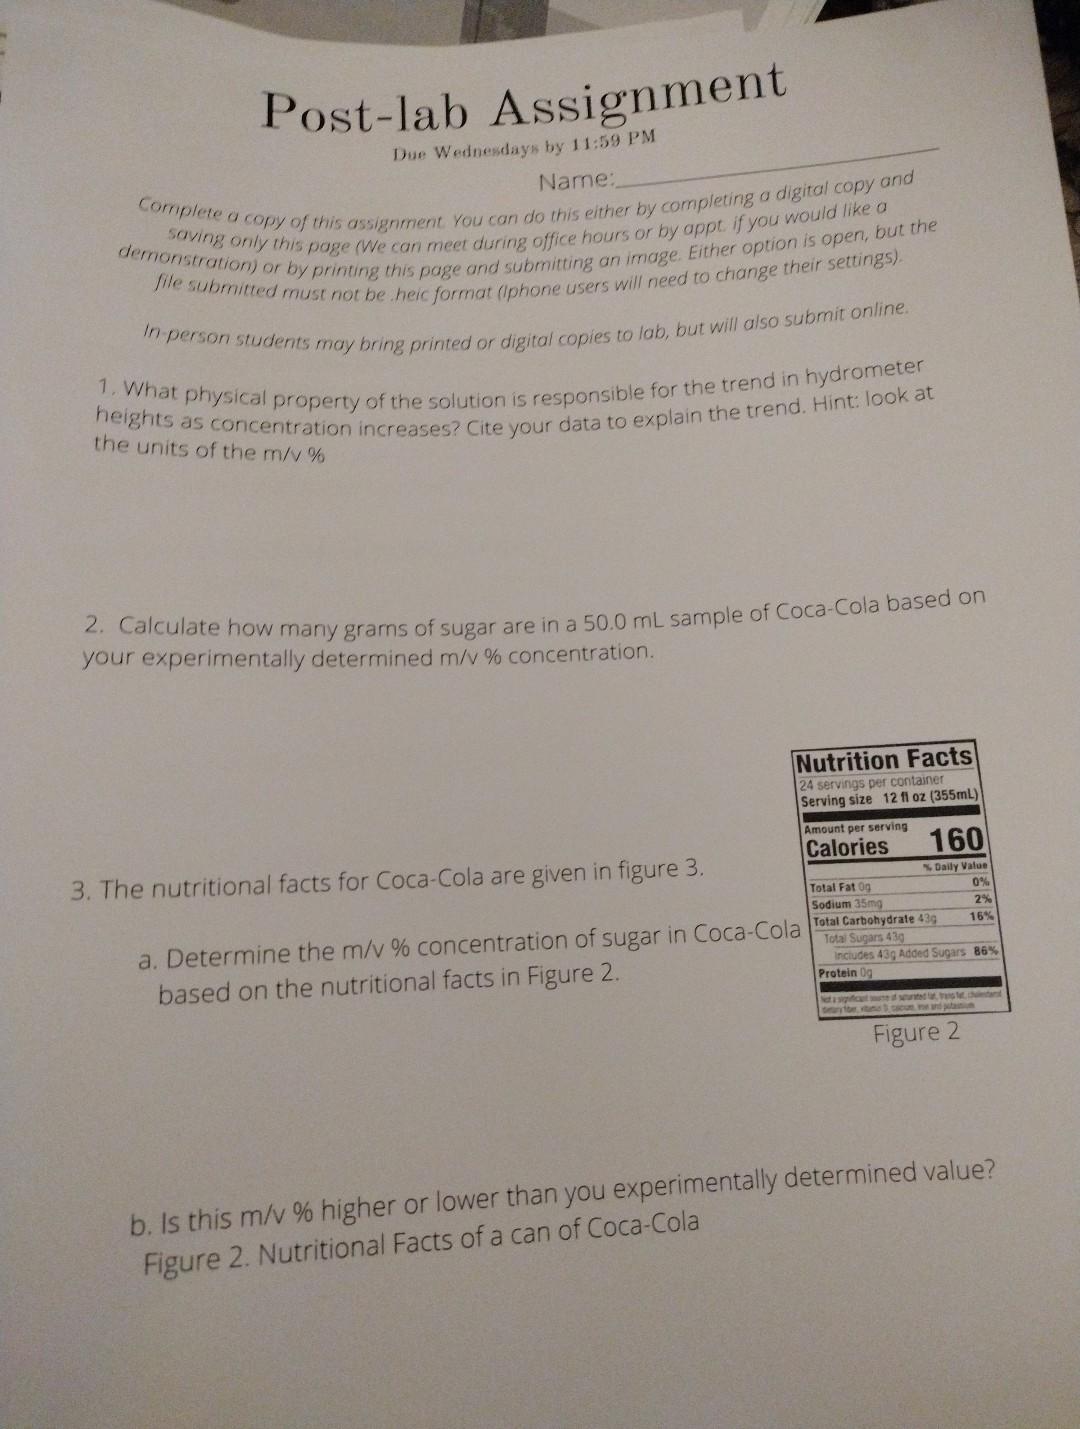
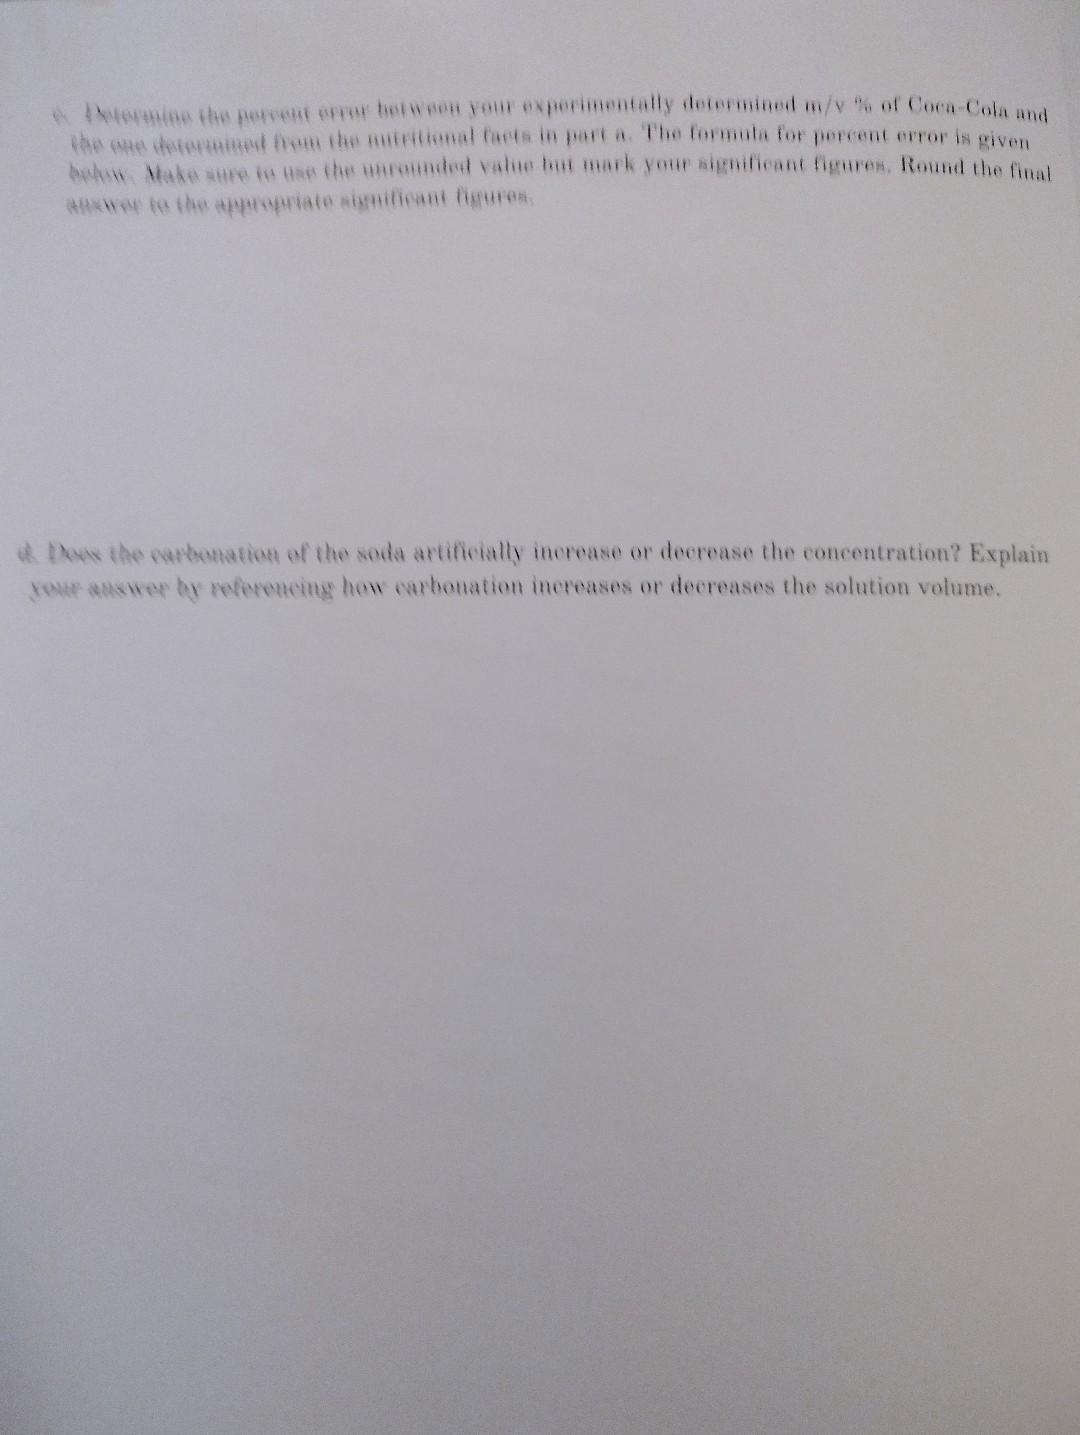
Table 2: Part B - Determination of Sugar Content in Beverages Table 3: Part C - Determination of Sugar Content in Unknown Solution \begin{tabular}{|c|c|c|} \hline Unknownnumber & Heightofhydrometerstem(cm) & PercentagebasedonExcelealibrationplot \\ \hline Hf 41 & 40cm & \\ \hline \end{tabular} Complete a copy of this assignment you can do this either by completing a digital copy and demonsing only this page (we can meet during office hours or by appt if you would like a file submitted must not be heic format (lphone users will need to change their settings). In person students may bring printed or digital copies to lab, but will also submit online. 1. What physical property of the solution is responsible for the trend in hydrometer heights as concentration increases? Cite your data to explain the trend. Hint: look at the units of the m/v% 2. Calculate how many grams of sugar are in a 50.0mL sample of Coca-Cola based on your experimentally determined m/v% concentration. 3. The nutritional facts for Coca-Cola are given in figure 3. a. Determine the m/v% concentration of sugar in Coca-Col based on the nutritional facts in Figure 2. b. Is this m/v% higher or lower than you experimentally determined value? Figure 2. Nutritional Facts of a can of Coca-Cola d. their the emponstiog of the sodi artifecally increase or decrease the concentration? Explain Jole answee by referencing hom carbonation increases or deereases the solution volume. Table 2: Part B - Determination of Sugar Content in Beverages Table 3: Part C - Determination of Sugar Content in Unknown Solution \begin{tabular}{|c|c|c|} \hline Unknownnumber & Heightofhydrometerstem(cm) & PercentagebasedonExcelealibrationplot \\ \hline Hf 41 & 40cm & \\ \hline \end{tabular} Complete a copy of this assignment you can do this either by completing a digital copy and demonsing only this page (we can meet during office hours or by appt if you would like a file submitted must not be heic format (lphone users will need to change their settings). In person students may bring printed or digital copies to lab, but will also submit online. 1. What physical property of the solution is responsible for the trend in hydrometer heights as concentration increases? Cite your data to explain the trend. Hint: look at the units of the m/v% 2. Calculate how many grams of sugar are in a 50.0mL sample of Coca-Cola based on your experimentally determined m/v% concentration. 3. The nutritional facts for Coca-Cola are given in figure 3. a. Determine the m/v% concentration of sugar in Coca-Col based on the nutritional facts in Figure 2. b. Is this m/v% higher or lower than you experimentally determined value? Figure 2. Nutritional Facts of a can of Coca-Cola d. their the emponstiog of the sodi artifecally increase or decrease the concentration? Explain Jole answee by referencing hom carbonation increases or deereases the solution volume
Step by Step Solution
There are 3 Steps involved in it
Step: 1

Get Instant Access to Expert-Tailored Solutions
See step-by-step solutions with expert insights and AI powered tools for academic success
Step: 2

Step: 3
Ace Your Homework with AI
Get the answers you need in no time with our AI-driven, step-by-step assistance
Get Started
Fundamentals Of General Organic And Biological Chemistry
Authors: John McMurry, David S. Ballantine
8th Edition
0134218329, 978-0134218328